Eyes On The Market Q4 2026
The Rithm Take
The Fed hiked for the first time since 2023 in September, and we think this isn't one and done. Given the resilience of the economy and inflation that has run too high for too long, we expect the Committee to keep removing accommodation through year-end.
We flagged pieces of this all year. Back in January, we argued the Fed's estimate of neutral was too low, meaning policy was less restrictive than it looked. In our Fed Preview, we noted the labor market had stopped giving the Committee a reason to wait. A week later, in Five Forces Repricing the Long Bond, we called the Treasury selloff structural and durable, not technical. All three calls have held: the hike came, and none of the five forces behind the rate move have reversed.
Higher rates are now reaching housing, where mortgage relief has reversed and equity access is shifting as a result, and in credit, where the AI-driven supply story from our AI Repricing piece is now colliding with a higher cost of capital.
Market Signals
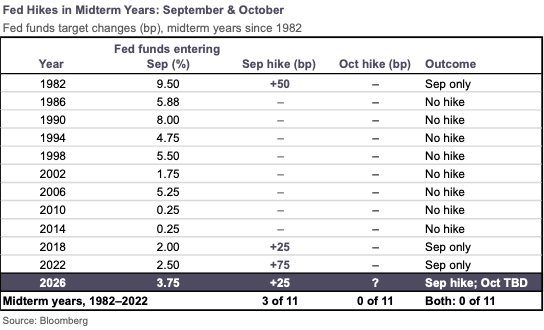
The Fed: Not One and Done. The Committee unanimously raised rates 25 basis points on September 16 to 3.75%–4.00%, its first hike since July 2023. July's FOMC saw three dissents in favor of a hike, the first such split since 2016, and Warsh's August 28 Jackson Hole address put responsibility for "65 months of sustained, elevated inflation" on the Fed itself, setting a standard that the Committee must see inflation moving to target "clearly and at sufficient speed. Otherwise, we have work to do." He also called financial conditions unrestrictive. History sets a high bar for October. The Fed hasn't hiked in October in 45 years, and hasn't done so in a midterm year since 1978. September's move was only the fourth midterm-year September hike since 1982, after 1982, 2018 and 2022, and none of those were followed by an October hike. We aren't calling October versus December, but we do think fed funds is higher by year-end, with 16 of 18 dots already showing at least one more hike and growth, labor and inflation all giving the Committee reason to keep going. The midterms may shape timing; but we don't think they change the ultimate path.
Labor and Inflation: A Well-Funded Consumer, Sticky Inflation. August payrolls rose 162,000, well above the roughly 55,000 consensus, and unemployment held at 4.1%. On the consumer, the share of card balances 90+ days delinquent rose from 7.6% in Q3 2022 to 12.8% in Q1 2026, which the press has framed as the worst since the Great Recession. But that rise reflects stale charged-off balances lenders now report for longer. The flow of households newly falling into serious delinquency has been roughly flat for almost two years, so household balance sheets are healthier than the headlines imply. Liquidity is strong too: J.P. Morgan's Consumer Cash Pile, which combines checking, savings and consumer money market funds, stood at $22.62 trillion in Q2, just off its Q1 record and up from $14.71 trillion at the end of 2019, with checking balances alone more than quadrupling to $6.34 trillion, and every income bracket outside the bottom 20% still holds more cash than in 2019 in real terms. On inflation, core CPI improved to 2.5%, but core PCE held at 3.3% with headline at 3.7%, and Warsh has flagged inflation breadth, 54% of the PCE basket running above 3% versus a 32% pre-pandemic norm, as evidence the improvement isn't broad enough. Hiring is holding, households have the balance sheets and cash to keep spending, and inflation is stuck well above target, with the improvement concentrated in a narrow set of prices.
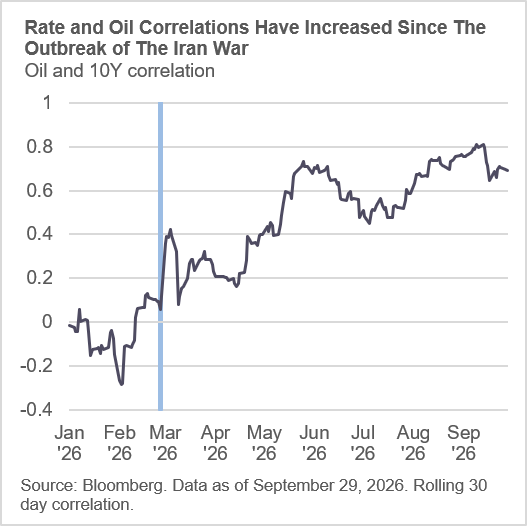
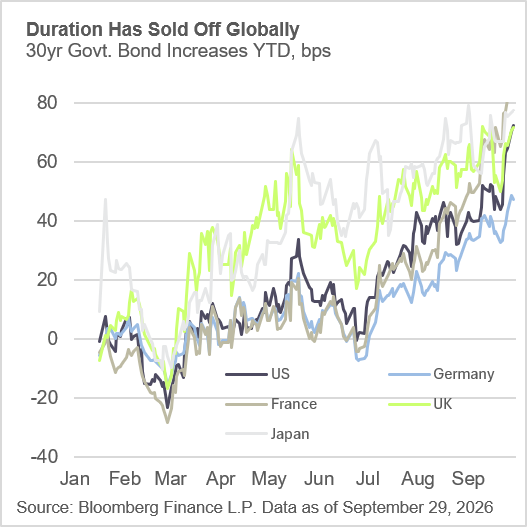
Rates: Five Forces, and We Don't See Them Reversing. September brought two of the largest single-day moves higher in yields since April 2025's Liberation Day, taking the 10-year above 5.3% and the 30-year through 5.6%, both highs since 2002. The five forces from Five Forces Repricing the Long Bond are all still pushing the same way. Oil has the sharpest beta: the Brent/10-year correlation is near year-to-date highs, and the 10-year is up more than 100bps in lockstep with crude since the conflict began. On fiscal, the average rate on marketable debt is 3.41% versus 1.47% five years ago, and net interest is 3.3% of GDP, above its 1991 post-war high. Growth is showing up in real yields, with July's 10-year TIPS auction clearing at the highest real yield since 2008, while record IG supply competes for the same long-end buyers and foreign demand thins as global yields climb. Absent a drop in oil, we expect yields to keep rising, with a hiking Fed keeping the most pressure on the front end and belly near term.
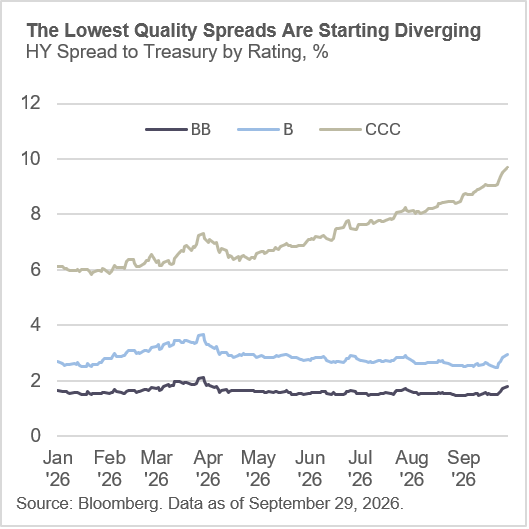
Credit: Hyperscaler Issuance Is Structural, Not a Fad. Investment grade issuance has reached $1.1 trillion year-to-date, up 39% over 2025, with hyperscaler borrowing adding roughly $157 billion on its own, now 14% of total investment grade supply versus under 2% in each of the prior two years. Capital is discriminating within the AI trade rather than leaving it, rewarding the physical buildout while pricing software risk higher for the first time in a decade. Aggregate corporate leverage is still below its 2020 peak, so the surge is being funded more from profitability and equity value than balance-sheet debt, a different starting point than 2000 or 2008. We expect bifurcation rather than a broad break which is starting to emerge within high yield ratings cohorts and investment grade sectors.
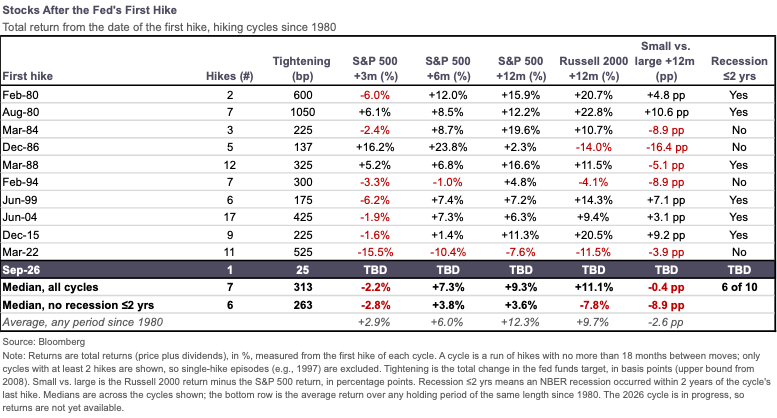
Equities: What Hiking Cycles Have Historically Meant. Q2 earnings were strong, adjusted S&P 500 growth of roughly 31%, though that predates September's move. Across six tightening cycles since 1994, the S&P 500 has typically dipped in the first few months after the initial hike (median -2.6% at three months) before recovering to a median +6.8% a year out, gaining over every full cycle since 1980 except 2022, when the pace of hikes broke the market. A Fed moving meeting to meeting rather than in rapid succession has historically meant milder drawdowns. When the Fed tightens into a strong economy, the impact tends to show up in leadership more than in the index: small caps and rate-sensitive sectors lag, while quality large caps with visible earnings growth lead. We favor large-cap quality and AI infrastructure over small caps and rate-sensitive groups.
Mortgages and Housing: Pressure Builds, Equity Access Shifts. The 30-year mortgage rate has moved into the low-7% range, erasing most of the relief from the GSE purchase program we've tracked all year. We expect housing pressure to persist given our rate view. Our August housing piece tracked the rate-lock effect through the FHA ARM channel, and the same dynamic now shows up in equity access, with cash-out refinancing uneconomical for most sub-5%-rate holders. Second-lien issuance (HELOCs and closed-end seconds) securitization reached $24 billion through July 24, the most for that point in the year since the financial crisis and close to all of 2025's $29 billion, according to Bank of America Securities, as owners tap equity while leaving their locked-in first mortgage untouched. Slower prepayments are also a tailwind for MSR values, extending servicing cash flows even as origination softens. We'd expect CES and HELOC growth to keep outpacing cash-out refi as long as the lock-in effect holds.