From Treasuries to Trillion-Dollar Capex: A GDP-Normalized Scorecard
Every dollar figure in markets means something different depending on the size of the economy sitting under it. A $40 trillion debt stock is a different statement in a $32 trillion economy than it was in a $15 trillion one. Normalizing to nominal GDP strips out decades of nominal growth and lets us compare today's scale of debt, equity concentration, capex, and housing leverage against prior cycles on equal footing.
Bottom Line: This cycle is scaling up unevenly. Government debt is near its post-war high relative to GDP, financed with a shorter portfolio into a widening deficit. Equity markets and AI-driven capex are more concentrated than at any point in the last 30 years. Credit markets are financing that buildout at a pace with no recent precedent. But corporate leverage has not re-levered to fund it, and households, the source of the last crisis, are less levered against their housing wealth than at any point in roughly three decades. The debt that has grown fastest sits with the government, not the private sector.
Market Signals
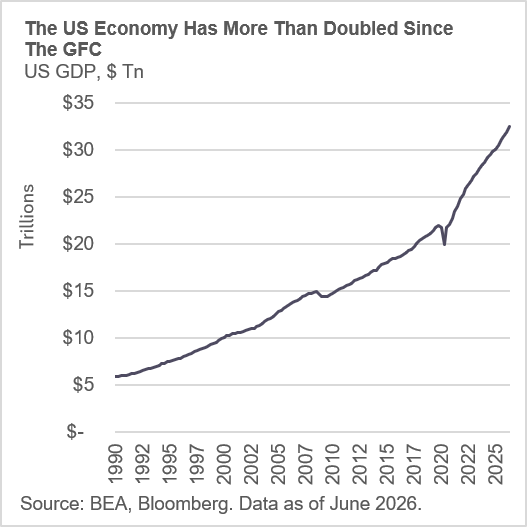
US nominal GDP has more than doubled since the financial crisis, from roughly $15 trillion to over $32 trillion. Every ratio below is measured against that moving target.
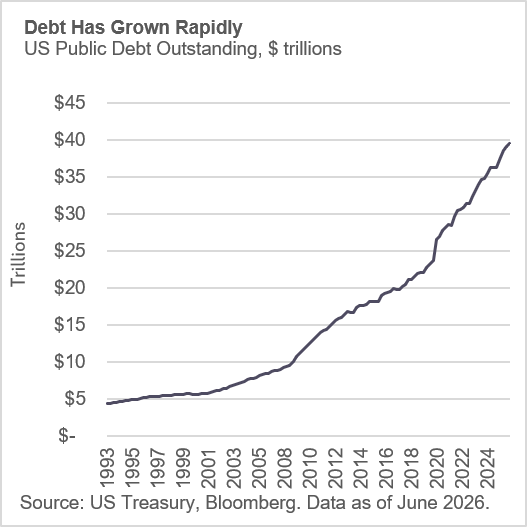
Federal debt outstanding has grown faster than the economy funding it, from under $10 trillion in 2008 to nearly $40 trillion today.
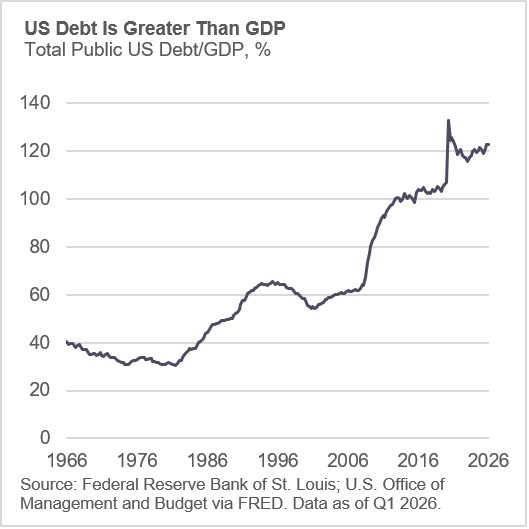
On a GDP-adjusted basis, federal debt is above 120% of GDP, roughly double its pre-2008 range and the highest print in the post-war data.
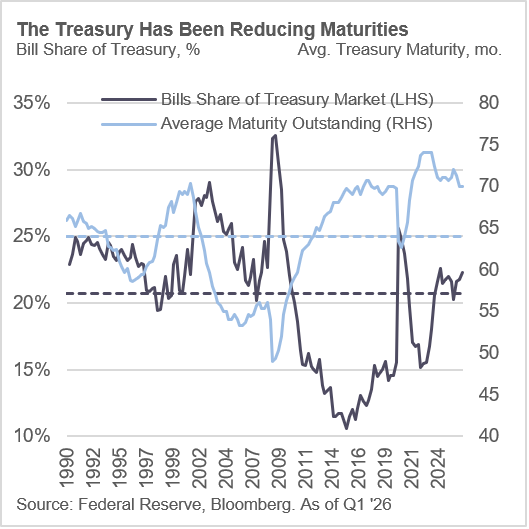
Treasury has offset part of that growth by shortening the portfolio. Bill share is climbing back toward levels last seen in the 2000s, while average maturity has edged down from its recent high rather than extending into a bigger deficit. CBO's February 2026 baseline projections, puts the deficit at 5.8% of GDP this year, widening to 6.7% by FY2036, with net interest doubling from $1.0 trillion to $2.1 trillion over the same stretch.
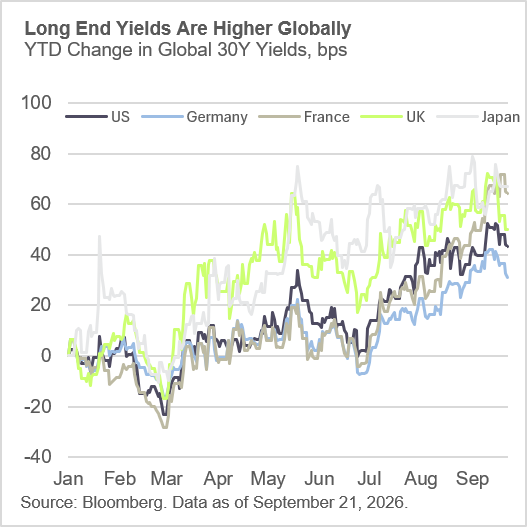
Long-end yields are higher almost everywhere this year, not just in the US.
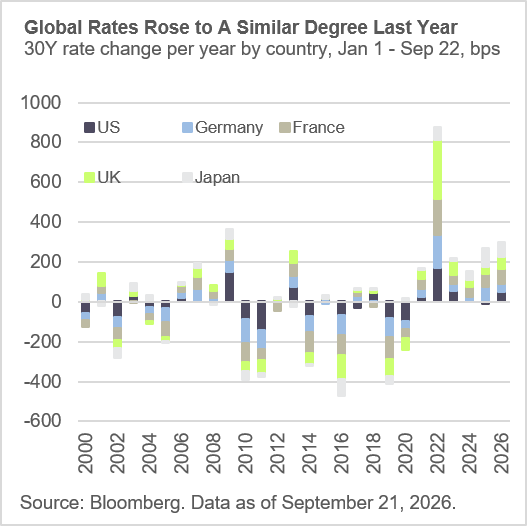
That move is not unusual by recent standards. Last year's increase in 30-year yields across the US and Europe was of a similar magnitude, and both were dwarfed by 2022.
The bigger structural shift this cycle is not in the debt or the rate complex. It is in how concentrated the equity market has become around the AI buildout, and how much of the real economy that buildout is now pulling through.
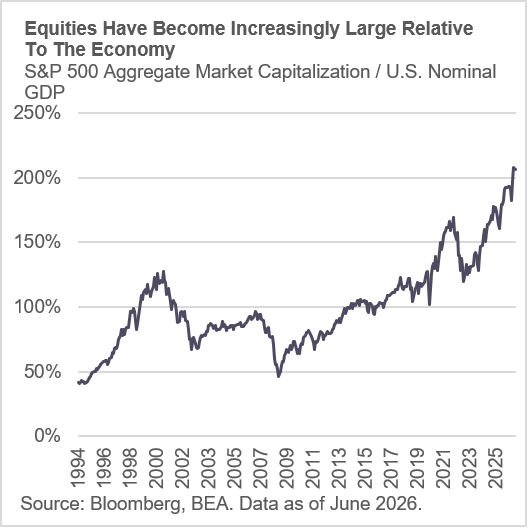
The S&P 500's market cap is now over 200% of GDP, above both the 2000 and 2021 peaks.
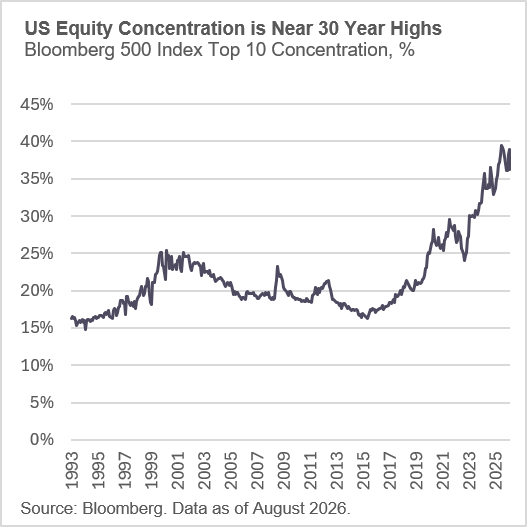
The top 10 names account for nearly 40% of index weight, the highest share in at least 30 years.
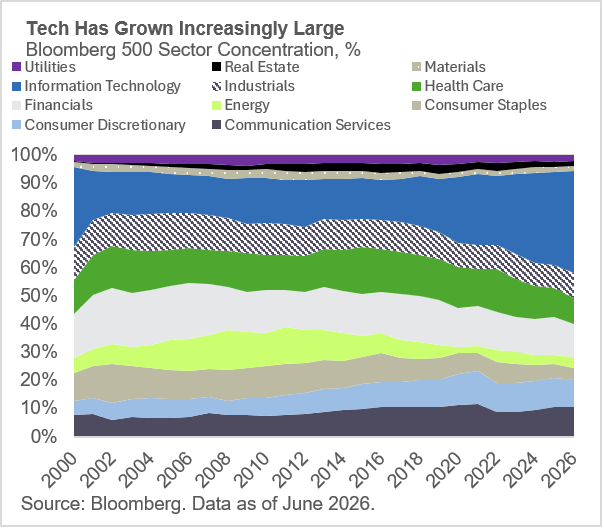
Information Technology and Communication Services together make up roughly half the index, up from roughly a quarter in the early 2000s.
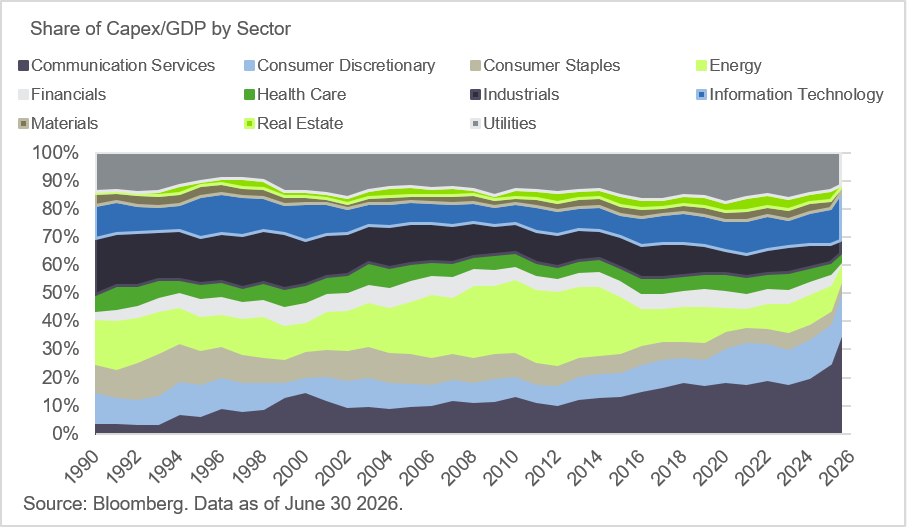
Capex tells the same story on the spending side. Communication Services' share of S&P 500 capex has jumped sharply over the last two years, with no precedent in this dataset back to 1990.
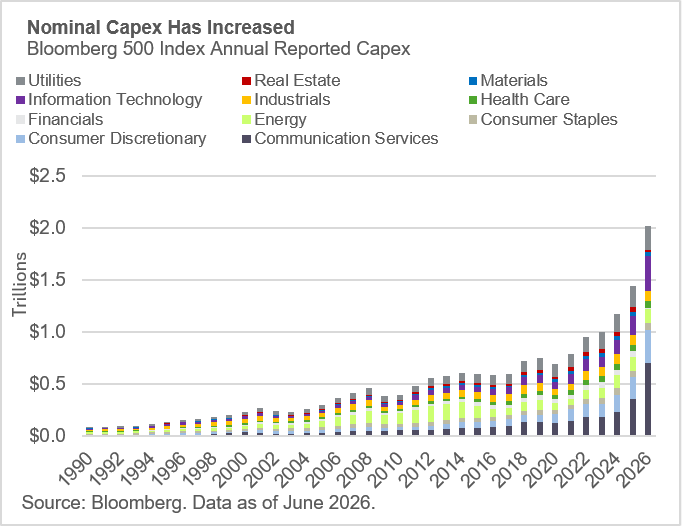
Total S&P 500 capex has crossed $2 trillion annually, roughly double its 2021 level, with Communication Services and Information Technology driving nearly all of the increase.
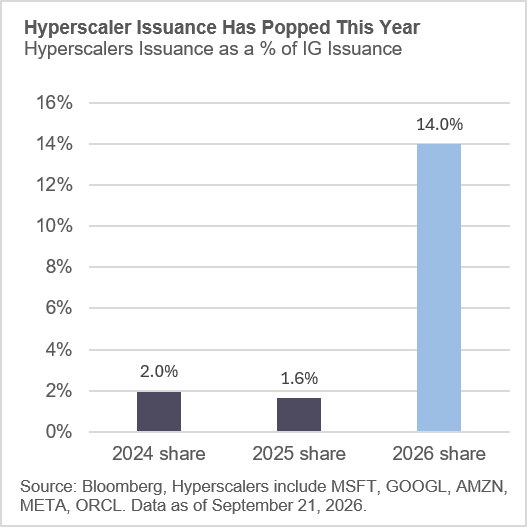
Credit markets are absorbing the same shift. Hyperscaler bond issuance from Alphabet, Amazon, Meta, Microsoft, and Oracle has reached roughly $157 billion year to date through September 21, 2026, 14% of total US IG gross issuance, up from under 2% in each of the prior two years.
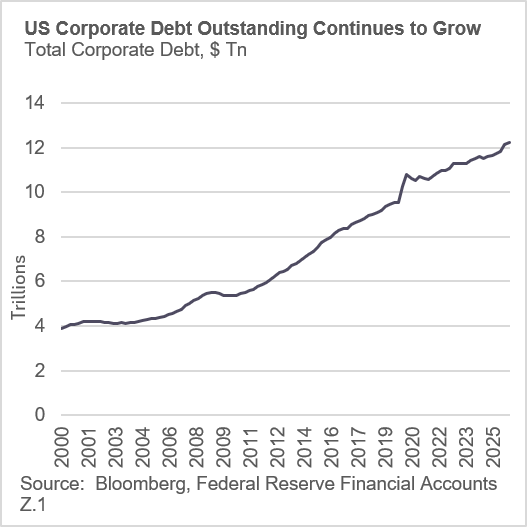
Even so, aggregate corporate balance sheets have not re-levered to match. Total US nonfinancial corporate debt has grown steadily to roughly $12 trillion.
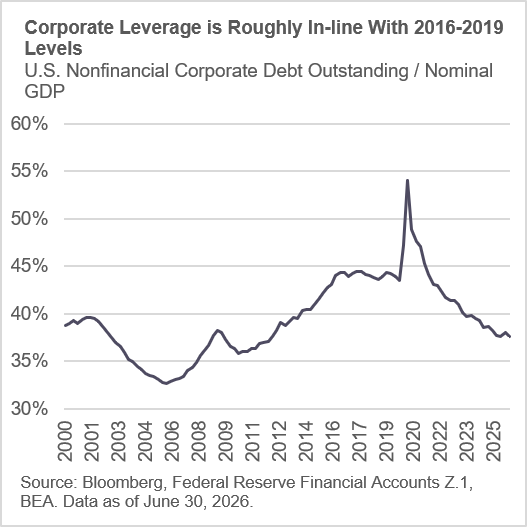
Relative to GDP, corporate leverage is actually below its 2020 peak and roughly in line with 2016-2019 levels. The AI capex and issuance surge looks funded out of profitability and equity value as much as balance-sheet leverage, a different starting point than 2000 or 2008.
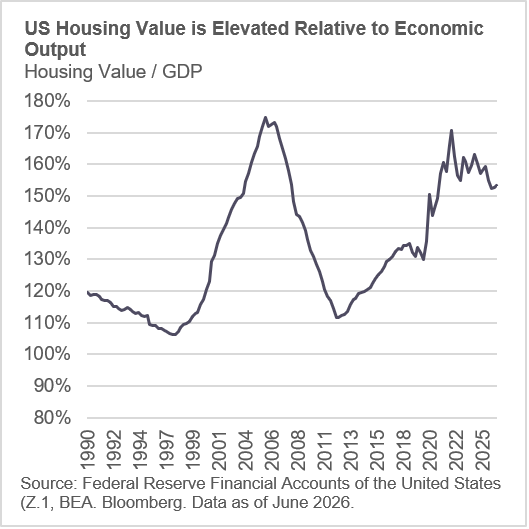
The other side of the 2008 comparison is housing, where the difference is leverage rather than price. Owner-occupied housing value is roughly 153% of GDP today, below its ~175% 2005-06 peak but still elevated by historical standards.
One-to-four-family residential mortgage debt has fallen to about 46% of GDP from a 76% peak in 2007-08.
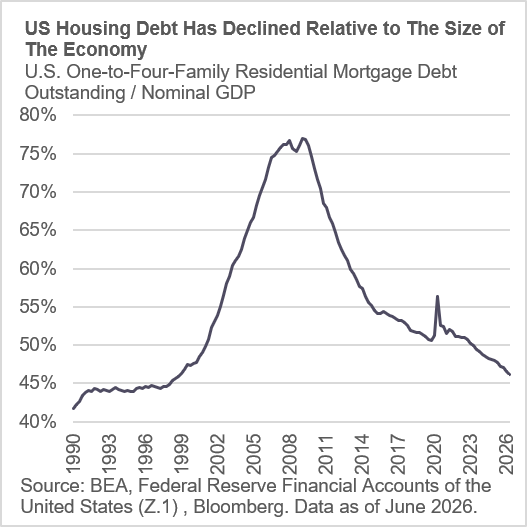
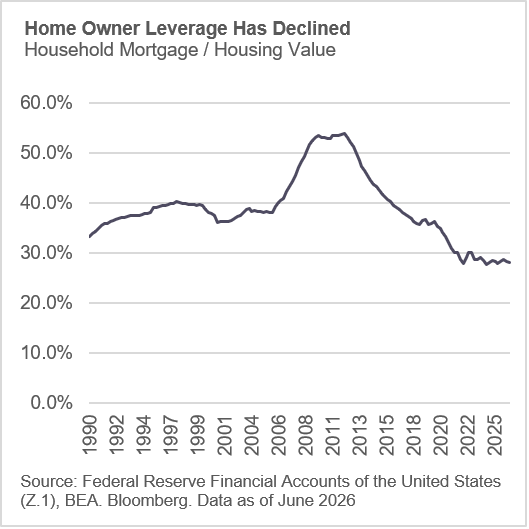
Household mortgage leverage against housing value sits near 28%, roughly half its ~54% peak in 2011-12.