Working off Excesses
All eyes on the consumer! In the equity markets, Q3 performance has Consumer Discretionary outpacing Consumer Staples, the former reversing its outperformance since the spring to now converging to the S&P index. Real Personal Consumption Expenditures (PCE) data rose solidly in June and July and softened in August.
“The Conversation”
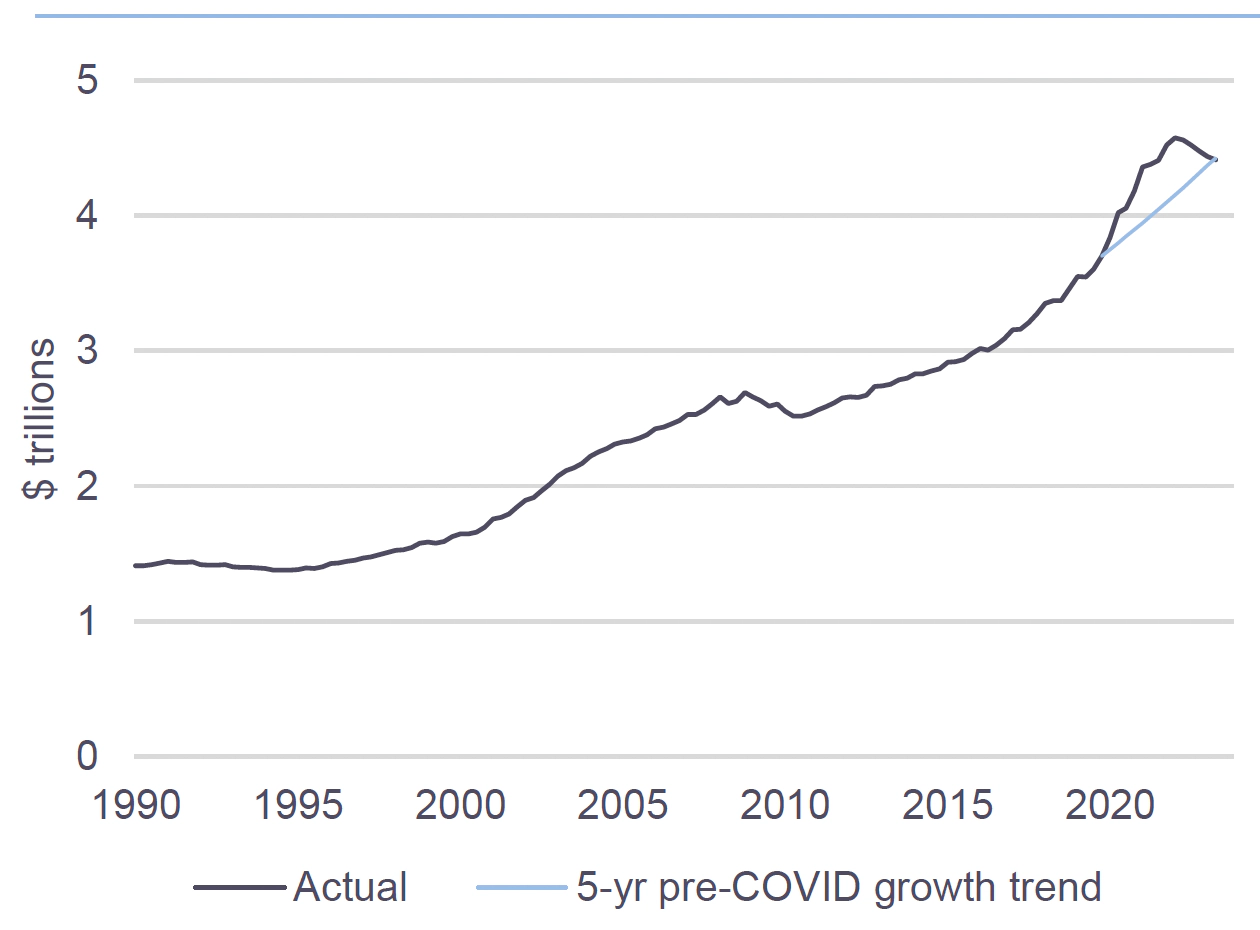
Boosting consumer spending has been the “excess savings” accumulated through the pandemic. This is now exhausted, notably for the middle of the income distribution. The $1.6tn in reported aggregate excess savings is squarely in the hands of the top quintile of the US population, who has less propensity to spend.
Consumer stresses are beginning to emerge. For example, 401(k) loans are on the rise across all age groups, led by those in the 50-59 age bracket who carry the highest loan balances, according to a new study by T. Rowe Price.
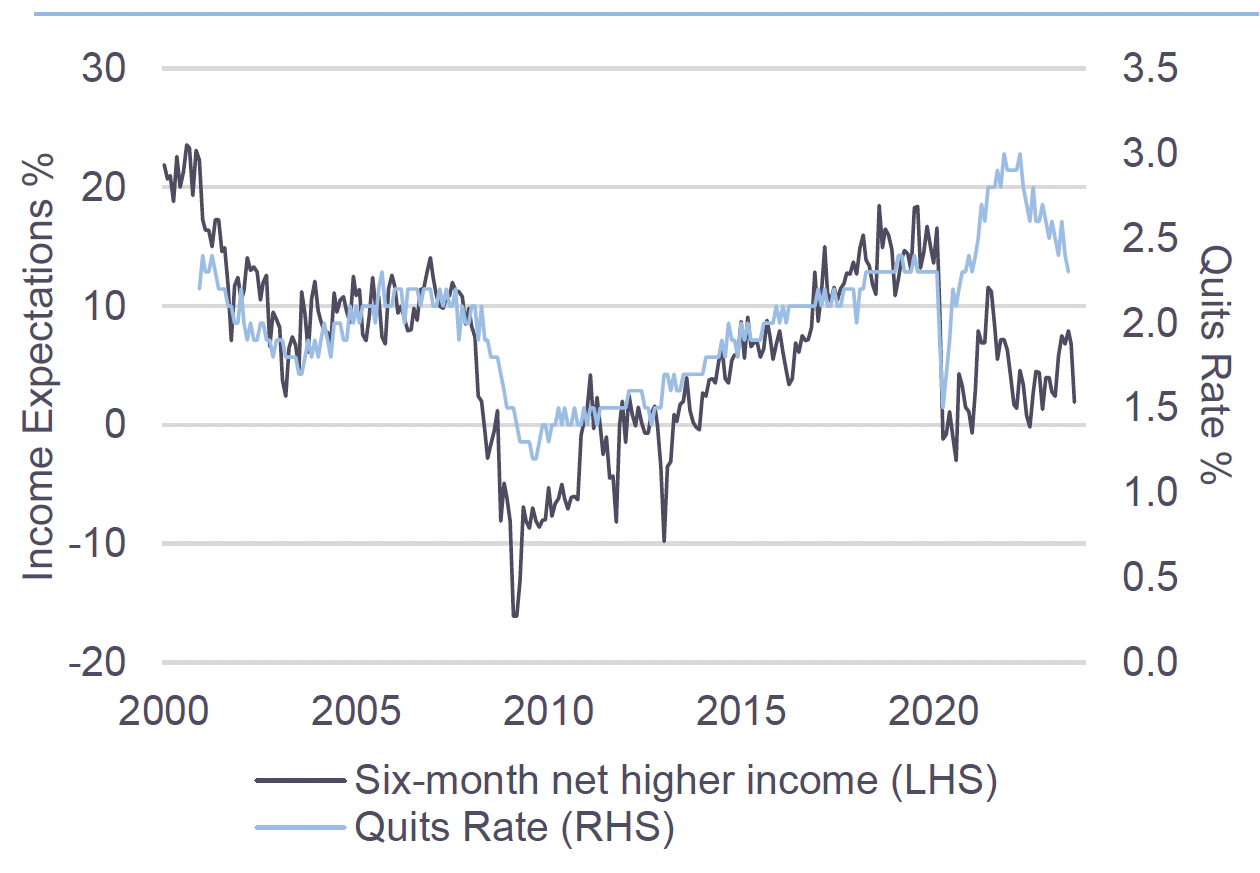
On the employment front, too, income expectations have been falling. The Quits Rate has been trending lower, signaling a turn in the employment picture, which is a reversion from the boost in employee confidence that occurred during the pandemic.
The consumer’s resilience thus far has supported the “soft landing” narrative. Consumer spending, however, is a coincident rather than a leading indicator, with businesses being the true engine of spending growth. Despite low aggregate debt-toincome ratios, consumer prioritization of debts to service – credit cards, autos, student loans, and mortgages, amongst others – could stand in contrast to past cycles. A key example is the Great Financial Crisis, when consumers defaulted on mortgages before other outstanding credit lines as home prices declined. In today’s environment, record home equity and work-from home could see mortgage payments being prioritized high on the debt service waterfall.
Household Cash, Bank Deposits, & MMF Shares 20th-80th Percentile of Income(1)
Consumer Net Income Expectations vs. Quits Rate(3)
The Rithm Take
The consumer has been a beneficiary of the public sector forces, pandemic stimulus, fiscal spending, and generational-low mortgage rates. The cycle is now turning, with the public sector excesses now driving Treasury yields and mortgage rates higher. The private sector is beginning to show emerging signs of stress, with rising default rates. This will eventually impact households, with consumer spending in the near-term likely driven by the hiring and compensation decisions of corporate America.