Where Does Housing Affordability Go From Here?
Higher mortgage rates and constrained supply continue to have a negative impact on housing affordability. Looking ahead to 2023, expectations for home prices and mortgage rates imply a wide range of outcomes on the affordability trends going forward.
Sharply lower affordability was a defining characteristic of the housing market in the second half of 2022. Home prices continued to increase from Dec ’21 to Oct ’22 with mortgage rates increasing 400bp during this time frame. A growth rate not seen since the early 1980s. In October – the latest available month of data – housing affordability fell to the lowest levels since August 1985(1).
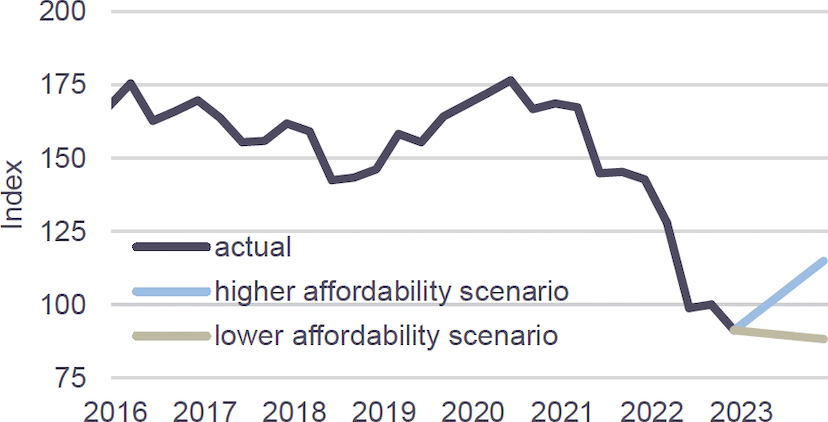
For affordability to improve, consumers need some combination of a reduction in home prices, household income growth, and mortgage rate stabilization. The left-hand chart below shows two affordability scenarios: scenario one shows housing affordability falling further to a new 38-year low (10% home price appreciation in 2023 and 6% mortgage rate), while the second scenario shows affordability improving to Q1 ’22 levels (8% home price depreciation in 2023 and 5.5% mortgage rate). For affordability to return to the 10-year average, a combination of a 35% drop in home prices and 6% mortgage rates are needed.
Once the affordability headwinds ease, demand from younger adults should add to the underlying demand for housing. Census Bureau data indicates that ~16% of adults aged 25 to 34 lived with their parents in 2022. This percentage sits above historical averages and only slightly below its peak of 17.8% in 2020. In addition, as illustrated in the right-hand chart below, the share of heads of household aged 25 to 29 is below what would be expected given their share of the overall population. A normalization of these two data trends implies an increased demand for housing from this demographic group once they are less constrained by poor affordability.
Fixed Rate Mortgage Housing Affordability Index(2)
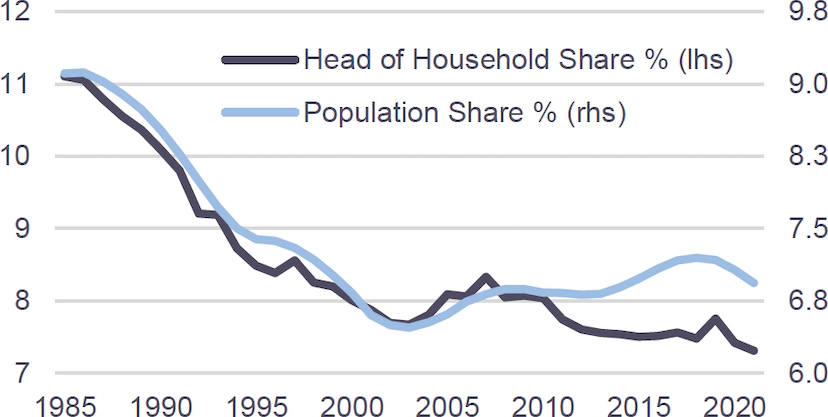
Households vs. Population Shares: 25- to 29-Year-Olds(3)
Relevant Market Metrics
|
Index |
December 31, 2021 |
November 15, 2022 |
December 15, 2022 |
|---|---|---|---|
|
2Y Treasury Yield |
0.73% |
4.43% |
4.22% |
|
10Y Treasury Yield |
1.51% |
3.77% |
3.46% |
|
Primary Mortgage Rate |
3.11% |
7.08% |
6.28% |
|
IG 5 Spread |
50 |
83 |
77 |
|
HY 5 Spread |
293 |
487 |
460 |
|
Yields by Asset Class(2) |
|
|
|
|
Single-Family Rental |
3.75 - 4.75% |
5.25% - 5.5% |
5.25 - 5.5% |
|
Business Purpose Loans |
6.5 - 8.0% |
9.0 - 9.5% |
9.0 - 9.5% |
|
Non-Qualified Mortgage |
4.0 - 4.5% |
8.0 - 8.5% |
8.0 - 8.5% |
Over the last month, rates and spreads rallied slightly, and we saw a stronger jobs report as well as a softer inflation report
Macro Takeaways
- Rates: As expected, the FOMC downshifted to a 50bps rate hike on December 14th following four consecutive 75bps increases. The real story was Fed Chair Powell’s hawkish conference and the new Fed projections showing a materially higher fed funds rate at the end of 2023 (amid higher projected inflation). Despite this guidance implying rate cuts won’t happen for a while, markets continue to anticipate Fed rate cuts next year.
- Volatility: Expect volatility to come down as the macro outlook becomes more certain leading into the new year.
- Liquidity: Liquidity may improve in the new year as uncertainty about the Fed policy path is reduced and the terminal fed funds rate comes into closer view.
- Spreads: Spreads are wide but off their highs and could tighten as liquidity improves, while the Treasury yield curve has become more inverted.
- Consumer: Despite the recent strong jobs report, markets remain concerned about how a recession will impact the consumer’s balance sheet and a potential depletion of savings.
Expected 2023 terminal Fed Funds rate(3)
Inversion of 2Y vs. 10Y treasury yields as of 12/15/22(1)
Of adults aged 24-to-29- years-old lived with their parents in 2022(4)