When Spreads Compress, So Does the GSE Bid
The Rithm Take
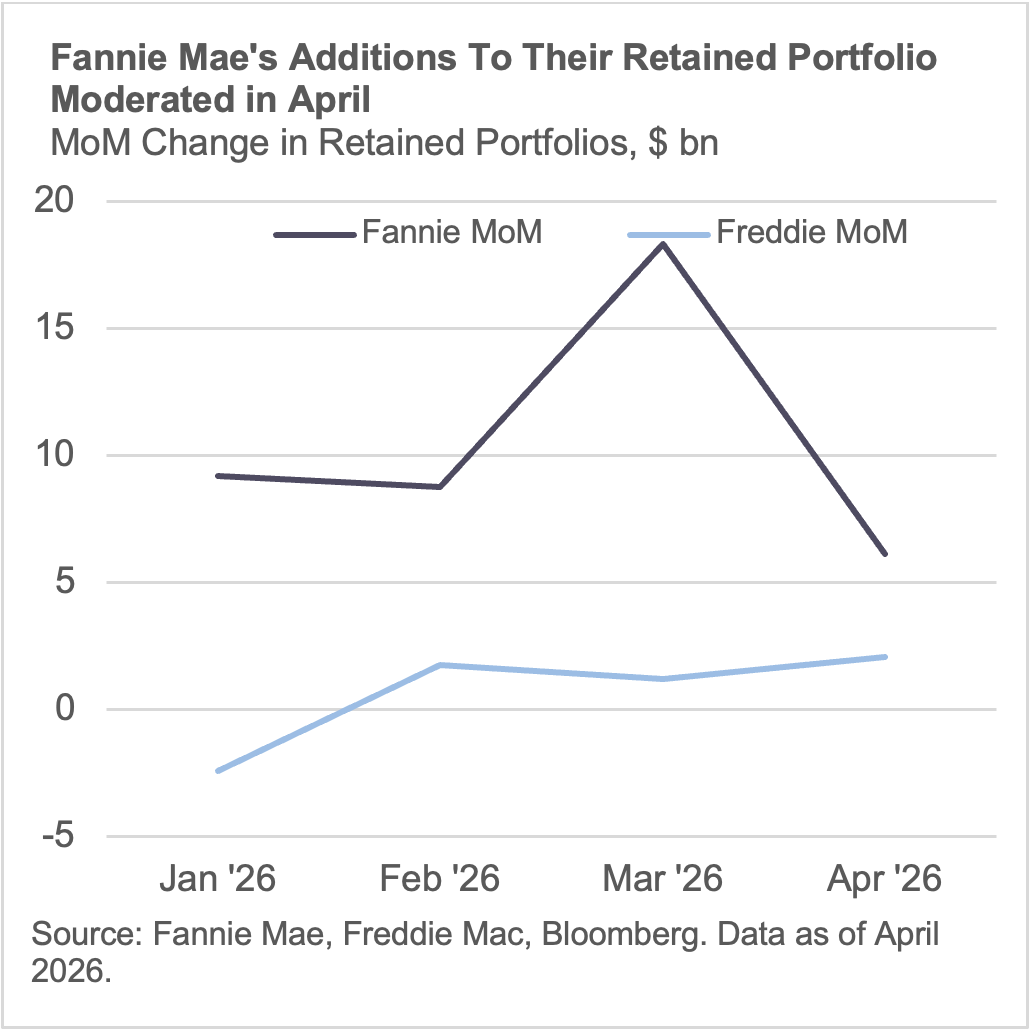
April's data landed where the economic buyer framework predicted it would. As agency MBS OAS averaged just below 20 basis points, down from March's 23, combined GSE portfolio growth stepped back to approximately $8 billion, versus $19.5 billion the prior month.
When we wrote in May that spread sensitivity, not a volume mandate, was governing GSE deployment, March was the evidence: Fannie added approximately $18.3 billion to its retained portfolio — the largest single-month increase since 2009 — as OAS averaged roughly 23 basis points. April confirmed the other side of that relationship. Spreads tightened, and the pace moderated.
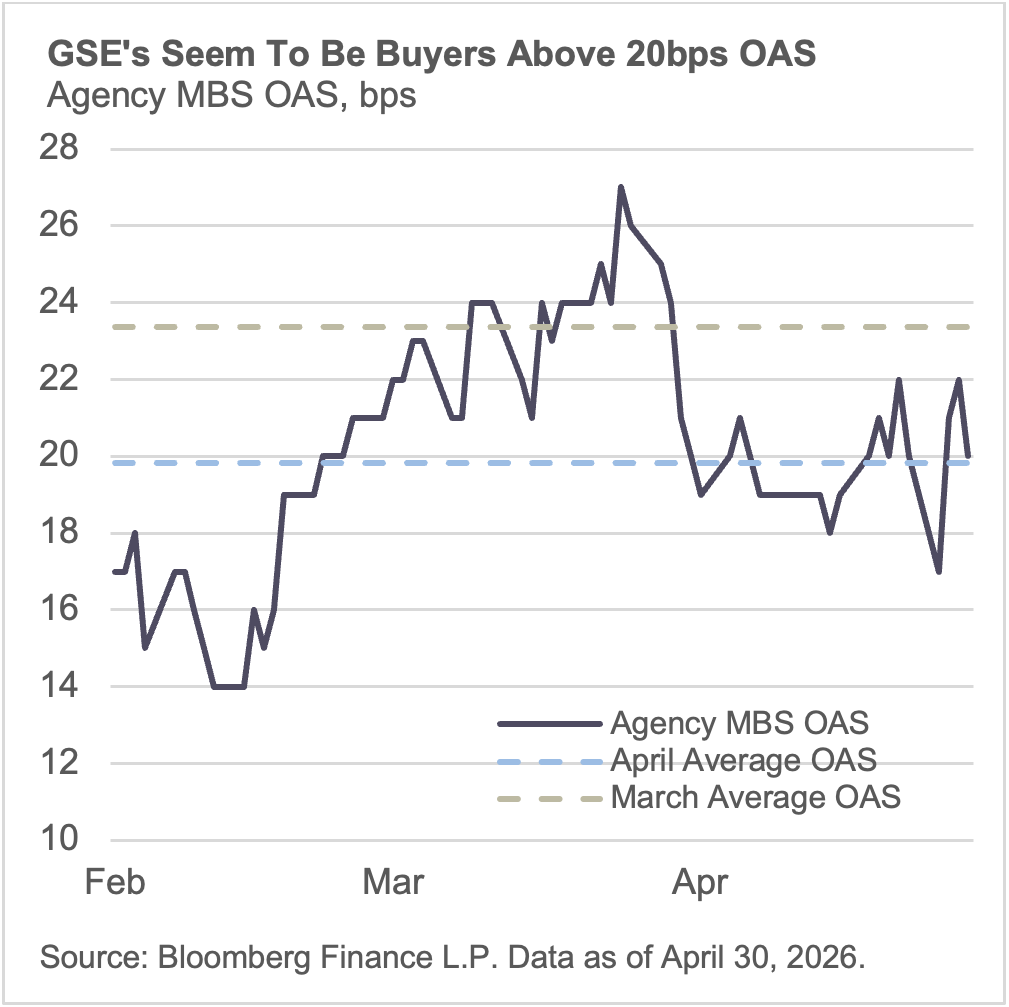
The GSEs appear to be operating against an implicit return threshold. The April data confirms the relationship is two-directional: wider spreads activate the bid, tighter spreads slow it. At 20 OAS today, the market is sitting at the lower boundary of where the GSEs have demonstrated willingness to buy at scale.
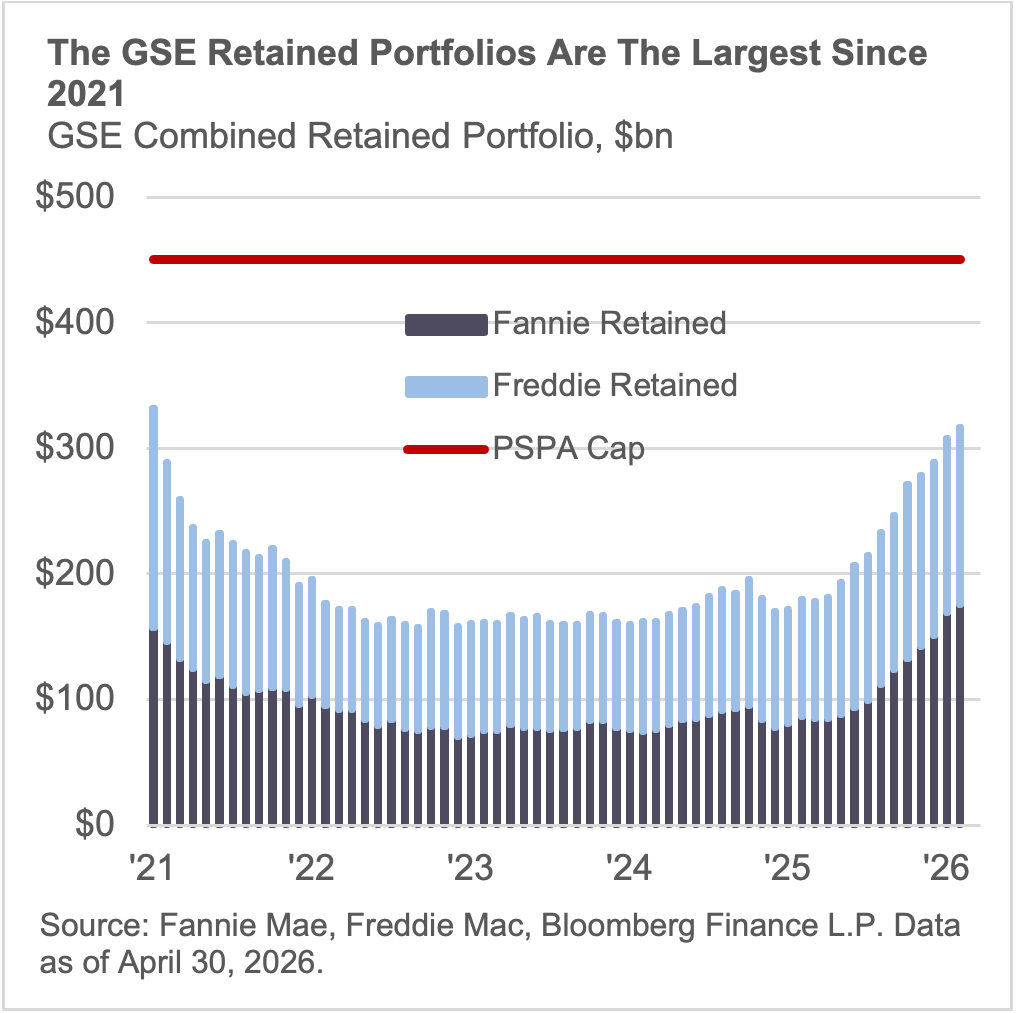
Bottom Line: The April data validates the economic buyer thesis and tightens the market's understanding of where the activation threshold sits. The GSE bid is spread-conditioned, and at current levels the market is priced right at the edge of that threshold. Capacity runway remains — the combined portfolios sit at roughly $317 billion against a $450 billion PSPA cap, but deployment from here will require spreads to hold above the level where returns are credible.
Market Signals
The pace decelerated as spreads compressed.
April's combined GSE portfolio growth of approximately $8 billion contrasts sharply with March's $19.5 billion. The change is directly traceable to OAS. March averaged roughly 23 basis points and triggered aggressive accumulation. April averaged roughly 20 basis points and the pace stepped back. The relationship between spread levels and deployment pace is now observable across multiple months.
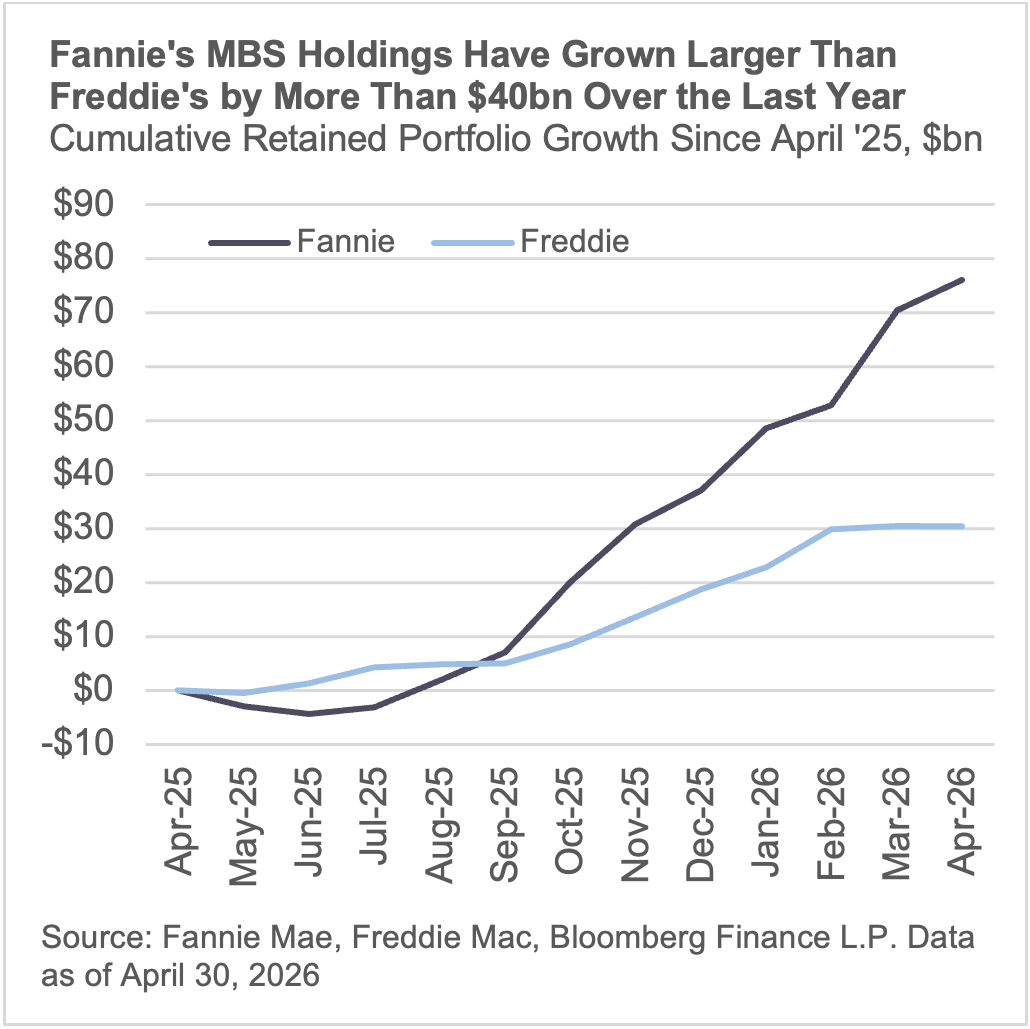
Fannie continues to lead, but the composition diverges.
Since March 2025, Fannie has added approximately $75 billion in MBS to its retained portfolio versus roughly $31 billion for Freddie. The asymmetry reflects a structural difference: Freddie holds a larger share of whole mortgage loans relative to securities, meaning a portion of its growth runs through correspondent and bulk channels rather than secondary market purchases. Fannie's heavier MBS weighting means its buying transmits more directly into secondary market spread compression.
Current OAS sits at the threshold.
At approximately 20 basis points today, agency MBS OAS is at the lower boundary of where the GSEs have accelerated purchases.
Capacity runway exists, with visible limits.
Combined GSE retained portfolios now stand at approximately $317 billion. Against the $450 billion PSPA cap, that implies enough runway for the program to persist at a moderate pace for an extended period, but not unlimited. The outer bound is visible, and any acceleration that approaches cap limits would require either an amendment to the PSPA framework or a structural policy decision.