What the Growth, Employment, and Inflation Matrix Suggests to Us
The Rithm Take
Investors have been facing a macro regime that continues to shift underneath them.
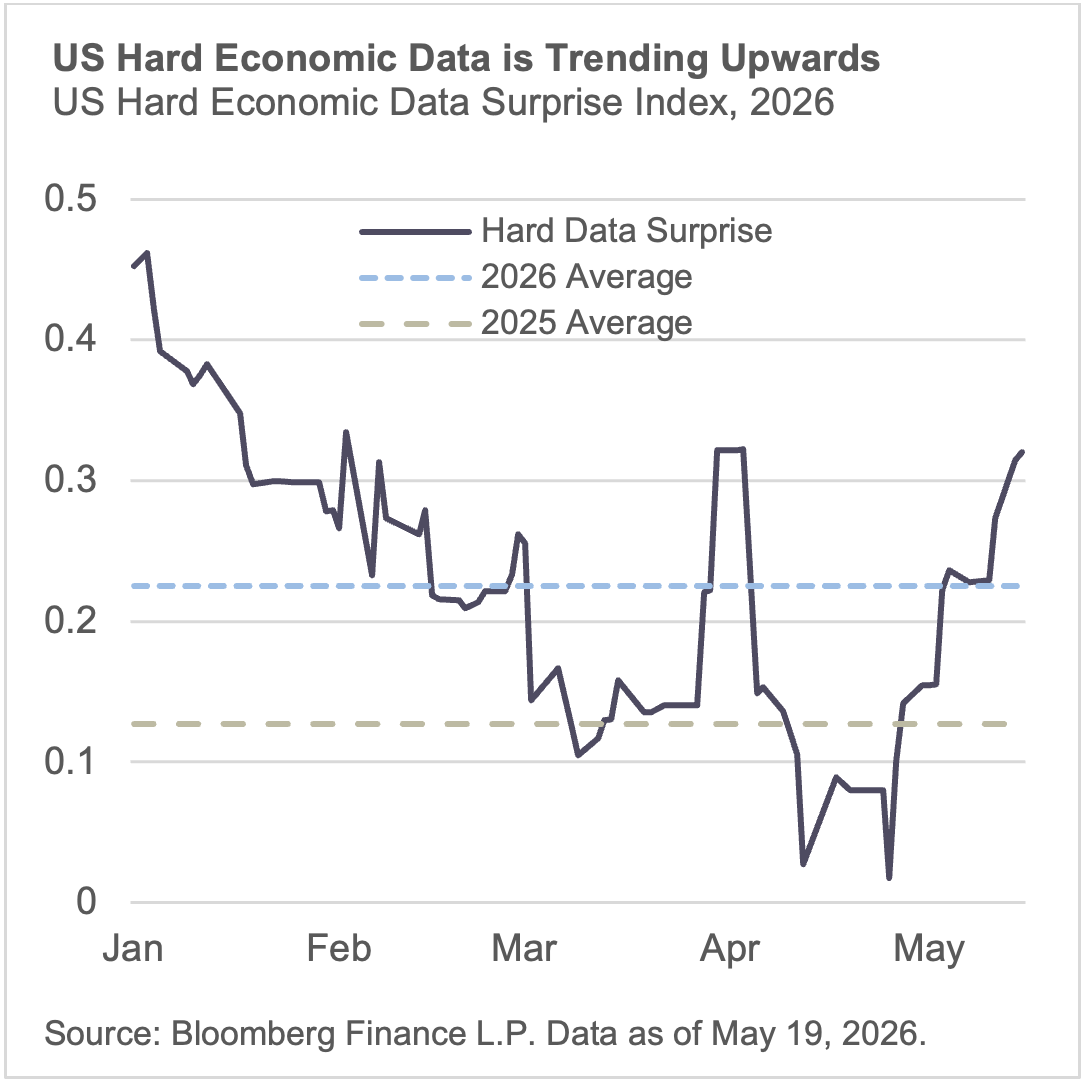
On growth: US growth data has been exceeding market expectations throughout 2026. US hard economic data which covers releases across consumer, production, labor market, investment, and housing indices have been 0.2 standard deviations above consensus on average in 2026 – which is nearly double the level seen in 2025. What’s more the data has been surprising to the upside even more strongly during May – despite the consensus view that the longer the oil supply is constrained the worse the growth hit will be.
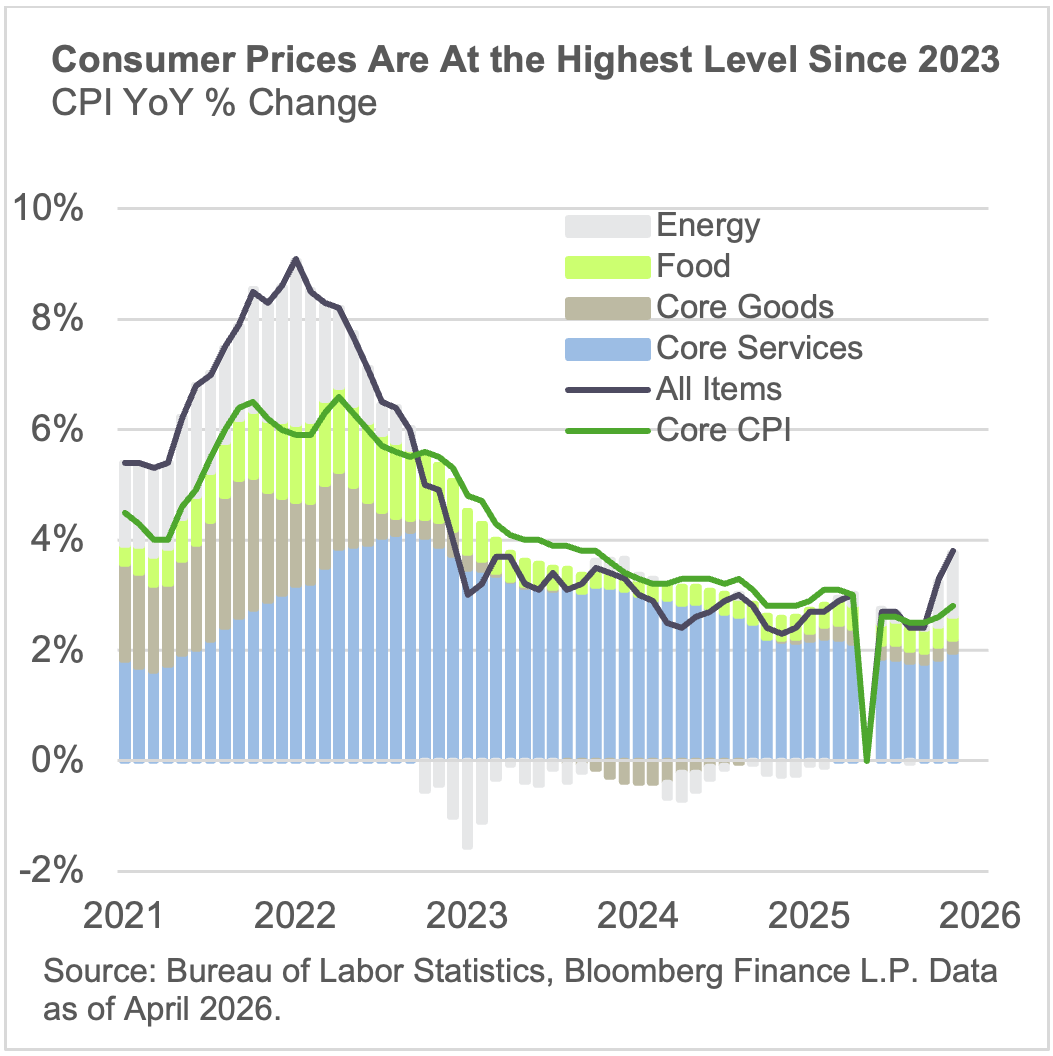
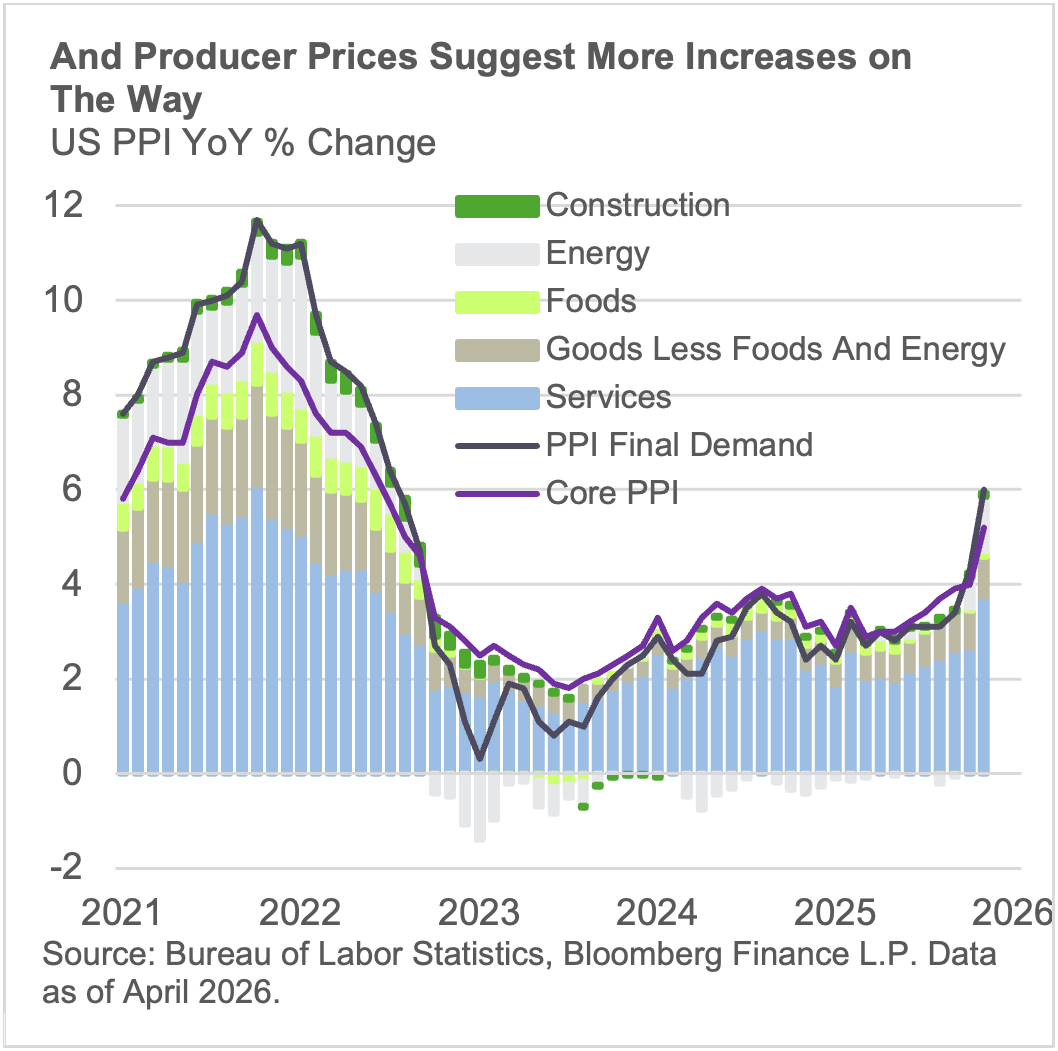
On inflation: Rising prices have been the obvious concern for investors since the start of the Iran War. Oil is up nearly 80% year-to-date and the concern is that those price increases will bleed into core prices.
On Employment: The US employment picture remains resilient. The unemployment rate has barely budged over the last year and is close to estimates of full employment, April added +115k jobs and marked the first back-to-back monthly gains in nearly a year.
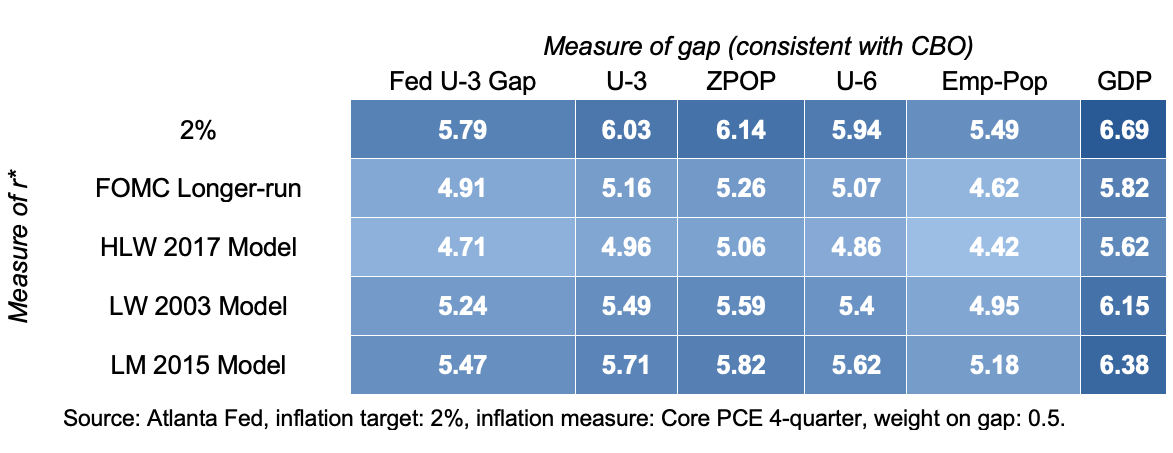
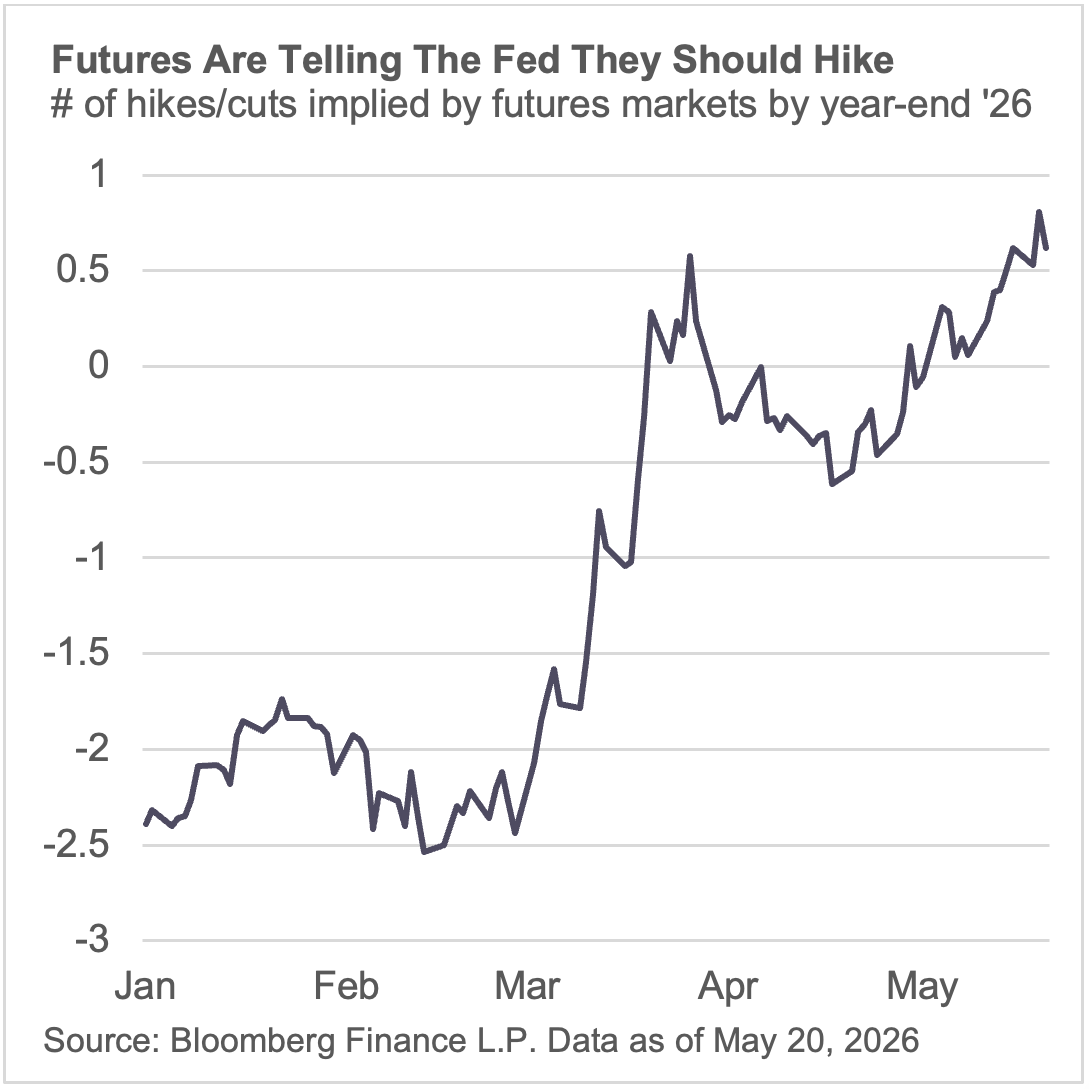
What does it mean for the Fed? It means the Fed is in a time of transition. Not only in leadership, with Chair Warsh set to be confirmed, but in the direction of the economic data itself. The Taylor Rule, which is a formula to determine the Federal Funds Rate using inflation and economic slack data, suggests that the policy rate should be materially higher than where it stands today.
Futures markets have shifted from pricing ~2.5 cuts this year to a 50% chance of a hike.
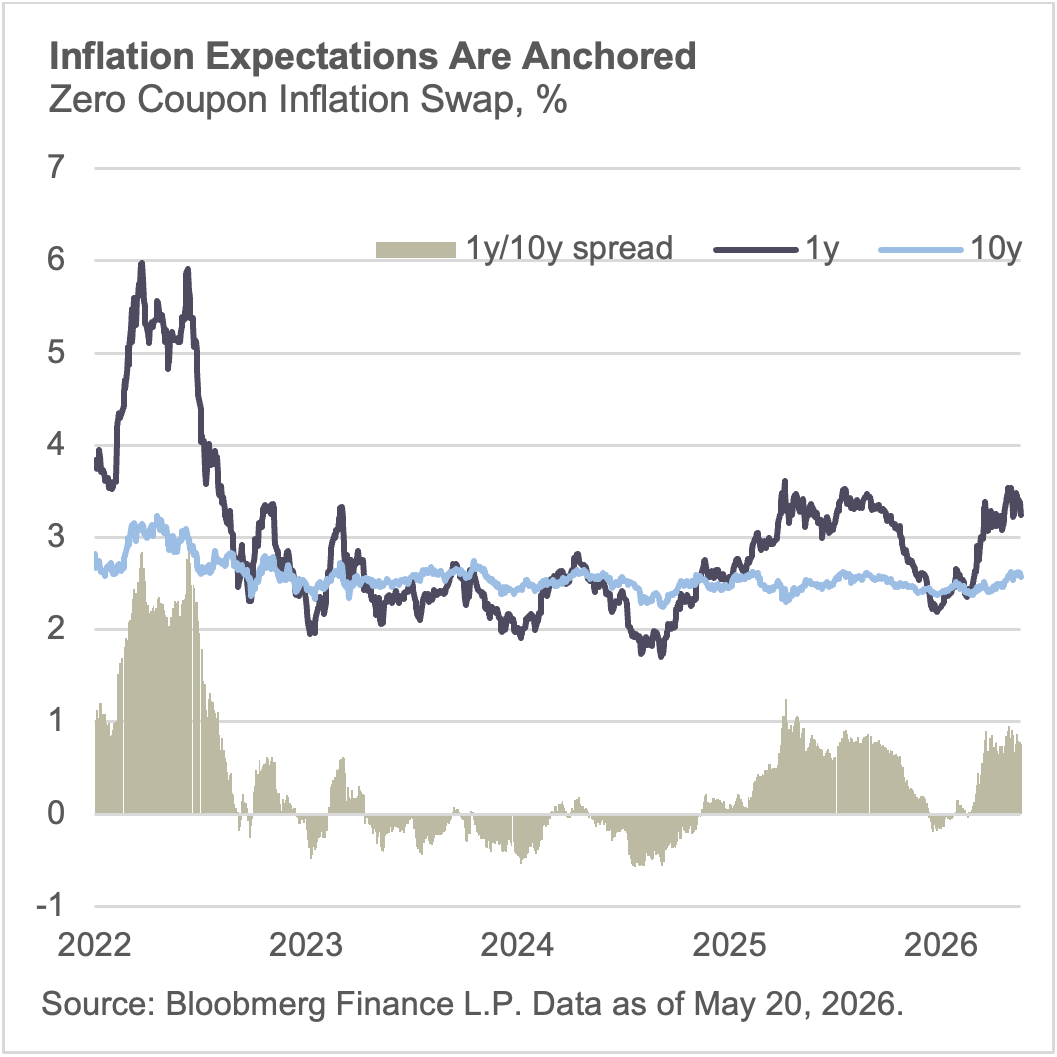
What does it mean for Markets? Markets are pricing higher inflation, zero-coupon inflation swap rates have risen across the curve, but expectations remain anchored. The diagnostic is the spread between short- and long-dated swaps. When the short end sits well above the long end (a positive 1y–10y spread), the market is pricing a near-term inflation shock that the Fed is expected to contain over the medium term; the long end stays moored to the policy target. The de-anchoring signal would be the opposite: the long end rising toward or above the short end, meaning investors no longer trust mean reversion. Today the 1y inflation swap at 3.24% sits 67bp above the 10y at 2.57%, and that gap has narrowed by 65bp over the past three months driven by the short end falling, not the long end rising. That is the anchored regime: a fading shock at the front, a stable anchor at the back.
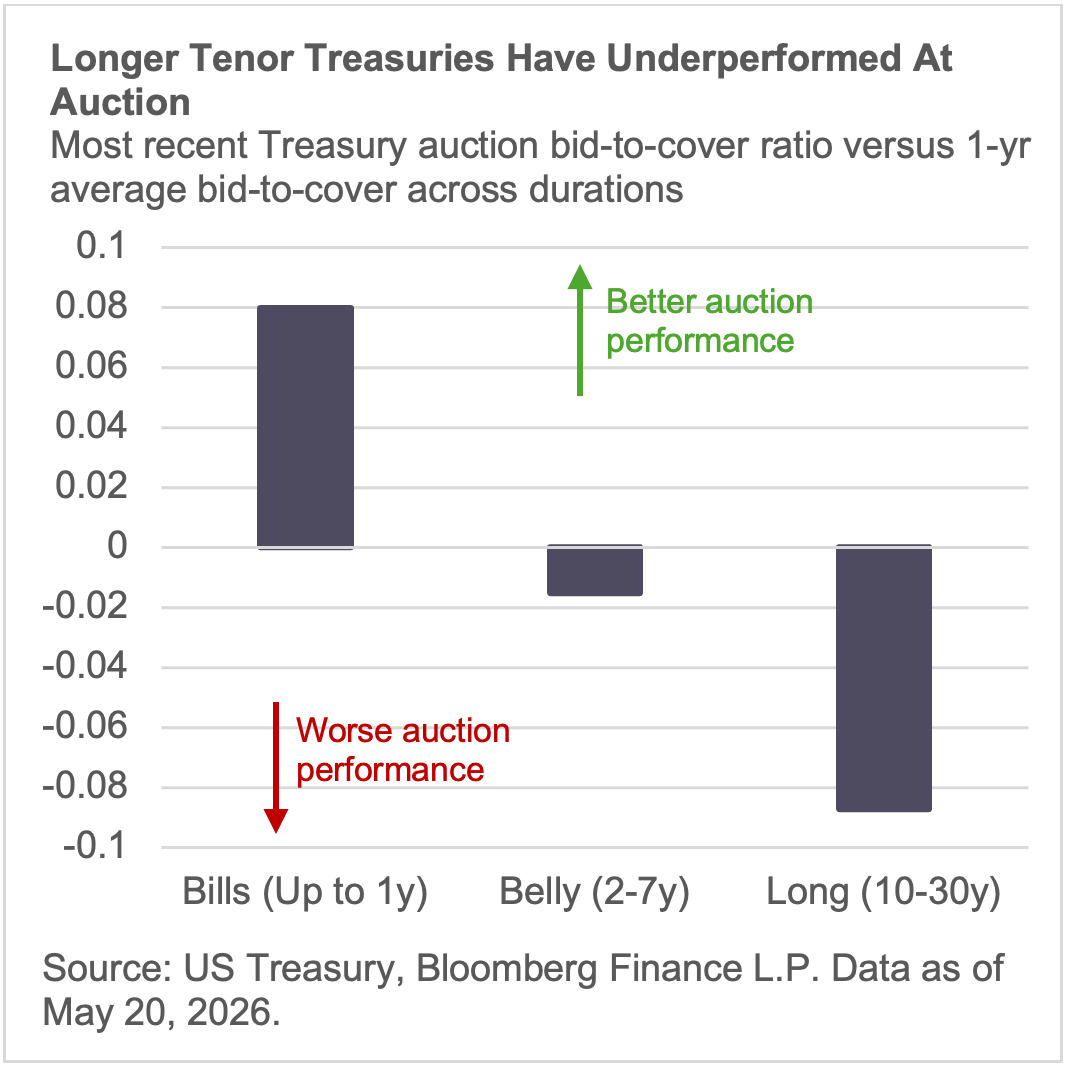
Nonetheless, higher inflation expectations have caused duration to sell off, the 30-year Treasury yield hit a two-decade high this week and evidence is emerging in auctions that investors are shifting preferences towards shorter duration securities. The bid-to-cover (BTC) ratio which measures the amount of bids relative to the size of the security auction can act as a gauge for investor demand – when measuring recent auction activity relative to one-year averages, shorter duration auctions have fared better than longer duration – indicates less appetite at the long-end.
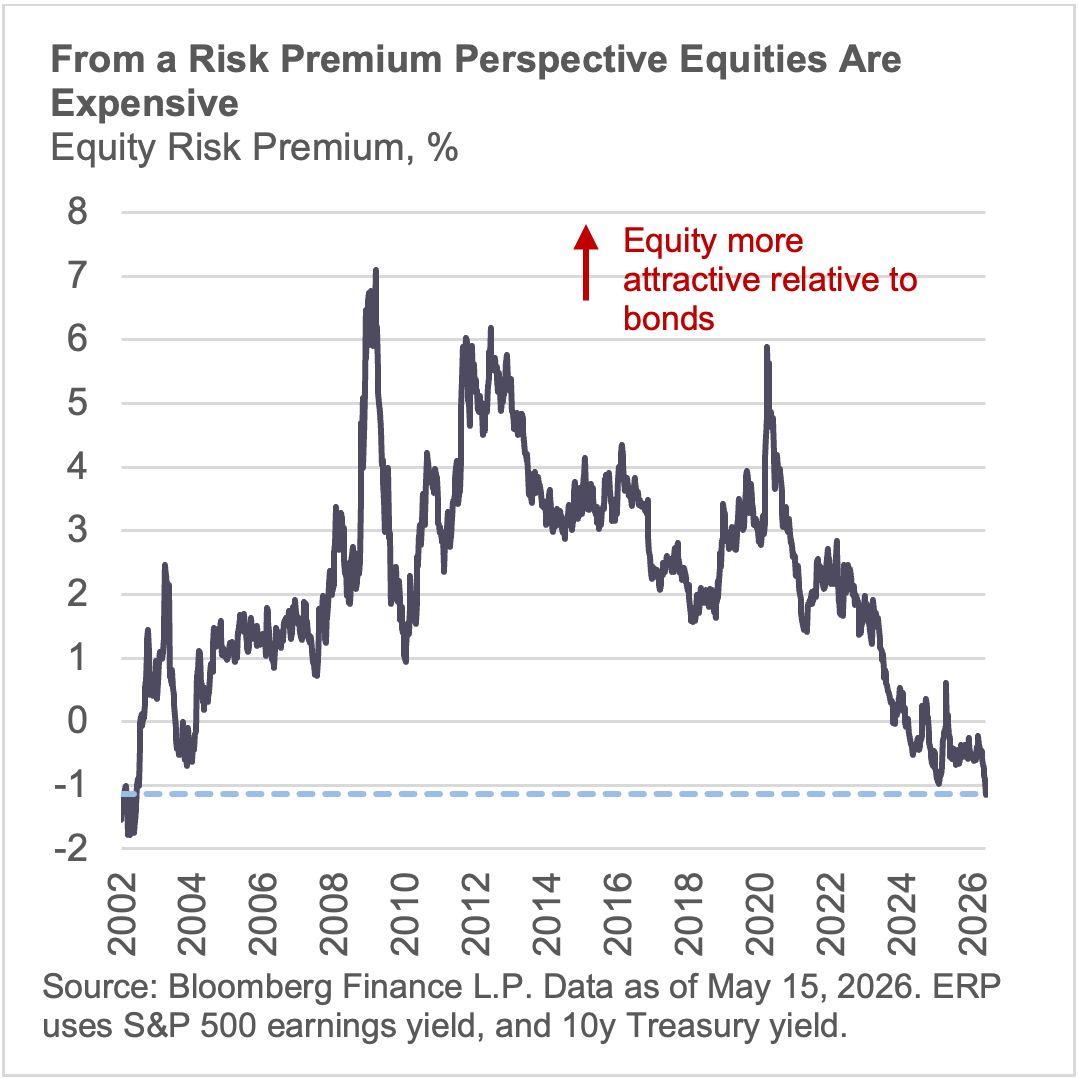
On a risk-premium basis, the 10y is offering the most value relative to the S&P 500 since 2002. But that value exists precisely because investors are wary of inflation risk, which they prefer to hedge through equities.
What does it mean for portfolios? The combination of resilient growth, elevated but anchored inflation, and a Fed moving toward restriction puts the traditional stock-bond diversification assumption under pressure. When inflation is the dominant risk, correlations between fixed income and equities increase — not our base case, but the risks have increased. Portfolios need another layer of diversification.
That layer, in our view, is collateralized, short-duration, cash-flowing credit. The Taylor Rule says policy rates should be materially higher than where they stand — front-end rates are staying elevated and may go higher. Short-duration assets capture that carry without the duration risk that has punished the long end. The 30-year at a two-decade high and weakening long-end bid-to-cover ratios tells us that repricing may not be finished. Meanwhile, the equity risk premium compression we highlighted — the 10-year offering the most value versus the S&P since 2002 — reflects a market hedging inflation through equities rather than bonds. That preference has pushed valuations to levels where the margin of safety is thin. Collateralized credit sits between: yields that can compete with equities, backed by hard assets that provide recovery value unsecured corporate credit does not. Asset-based finance and mortgage credit — where income is high, duration is short, and collateral is physical are where portfolios can add resilience.