Private Credit, At an Inflection Point
The Rithm Take:
The debate around private credit and direct lending in particular tends to toggle between alarm and reassurance, both pointing at the same data. Default rate estimates range from 2% to 6% depending on methodology — not because analysts disagree, but because the measures capture fundamentally different things. That range is less informative than what sits underneath it: non-accruals across BDC portfolios run from near zero to double digits by platform. The next phase of direct lending will continue to be defined by that dispersion, not by the headline number.
Bottom Line: Direct lending will survive the normalization ahead. The returns, and the losses, will not be distributed evenly. Manager selection, vintage composition, and funding structure are the dividing lines. The five charts below define what to watch as the 2028 wall approaches.
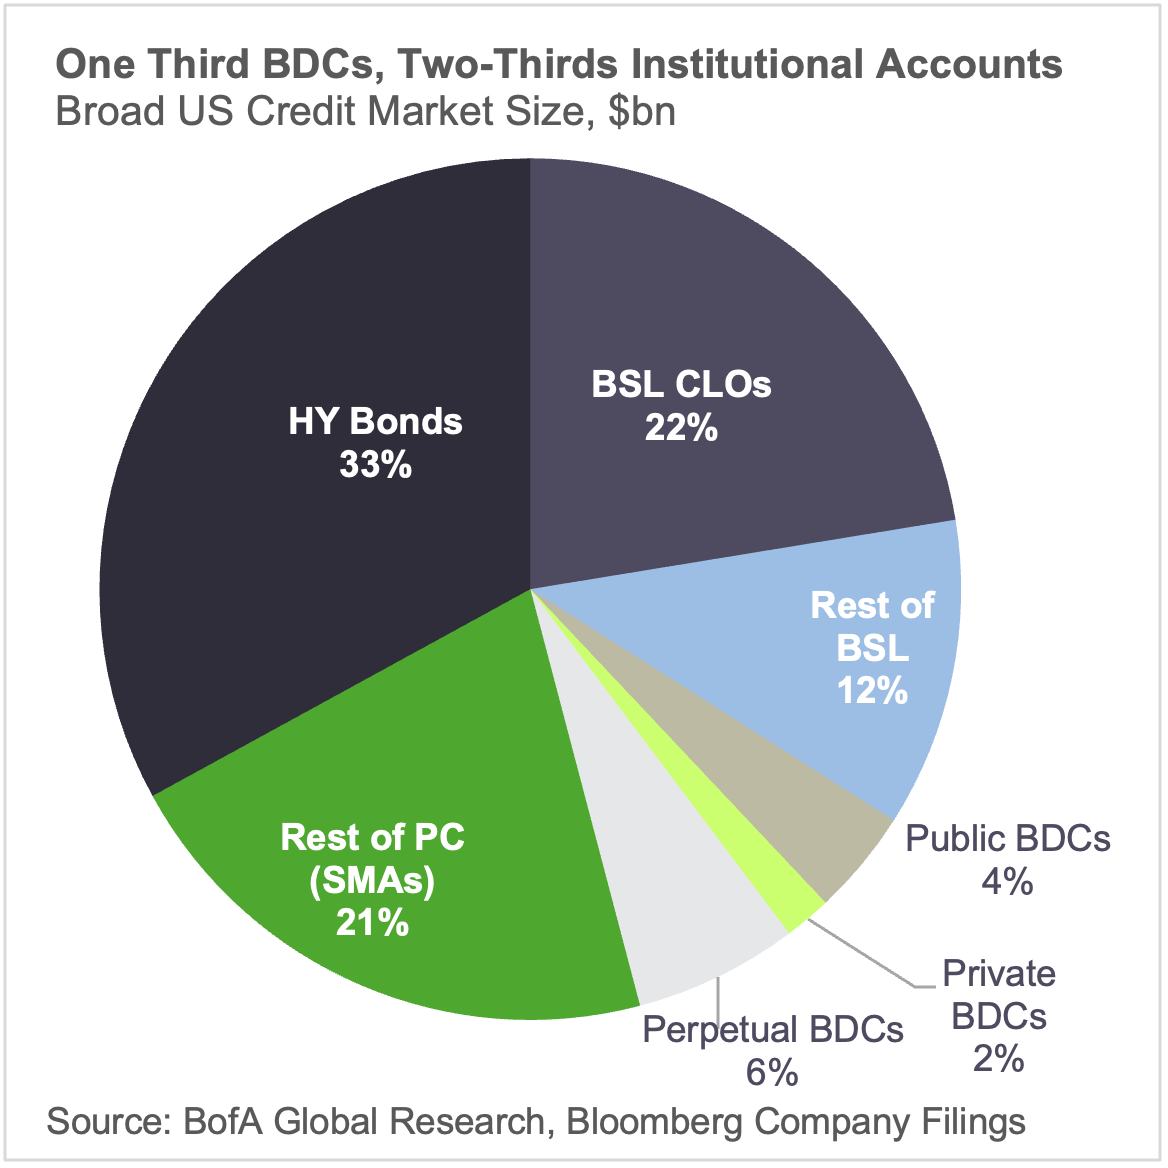
1. Outstandings and Growth. The $1.5 trillion direct lending market breaks roughly into thirds: one third in BDCs, two thirds in institutional accounts — insurance, pensions, sovereign wealth. The institutional portion carries no redemption pressure and is a genuine long-duration holder. The retail BDC channel is a different story. Perpetual private BDCs raised aggressively into high base rates in 2022 and 2023 and delivered double-digit levered returns. That yield argument has faded with falling rates and tighter spreads, and those vehicles are now in net outflow, enforcing 5% quarterly redemption caps. The vehicles meeting those redemptions appear to be using paydowns or leverage to meet those requests, and in cases where they do not cover, selling their more liquid names first leaving behind what was hardest to move at a fair price.
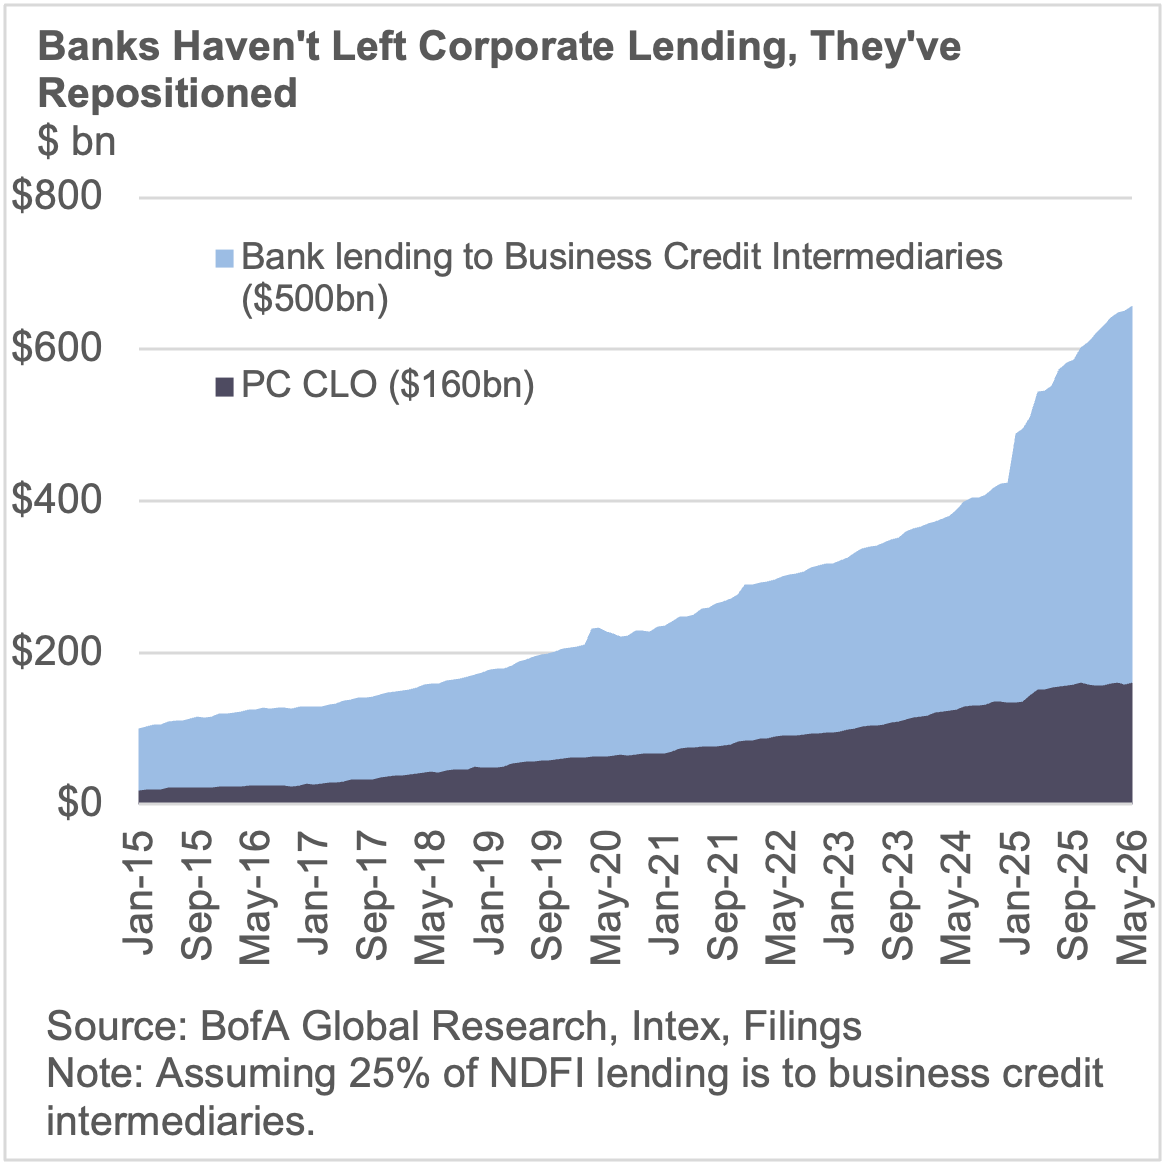
2. Bank Lending to Private Credit. Banks did not exit corporate lending — they repositioned inside it. Lending to private credit platforms has grown alongside the asset class itself, with banks collectively extending approximately $350 billion to Non-Bank Financial Institution (NBFI) asset managers. The regulatory economics explain why: simplified supervisory formula approach (SSFA) treatment produces roughly 50% ROE on those facilities, versus around 10% for a direct leveraged loan. That incentive is durable. What is less stable is the mark-to-market structure of the facilities themselves — advance rates, eligibility criteria, and concentration limits that can trigger margin calls precisely when secondary market liquidity is thinnest. The funding structure that enabled direct lending’s growth carries its own procyclicality.
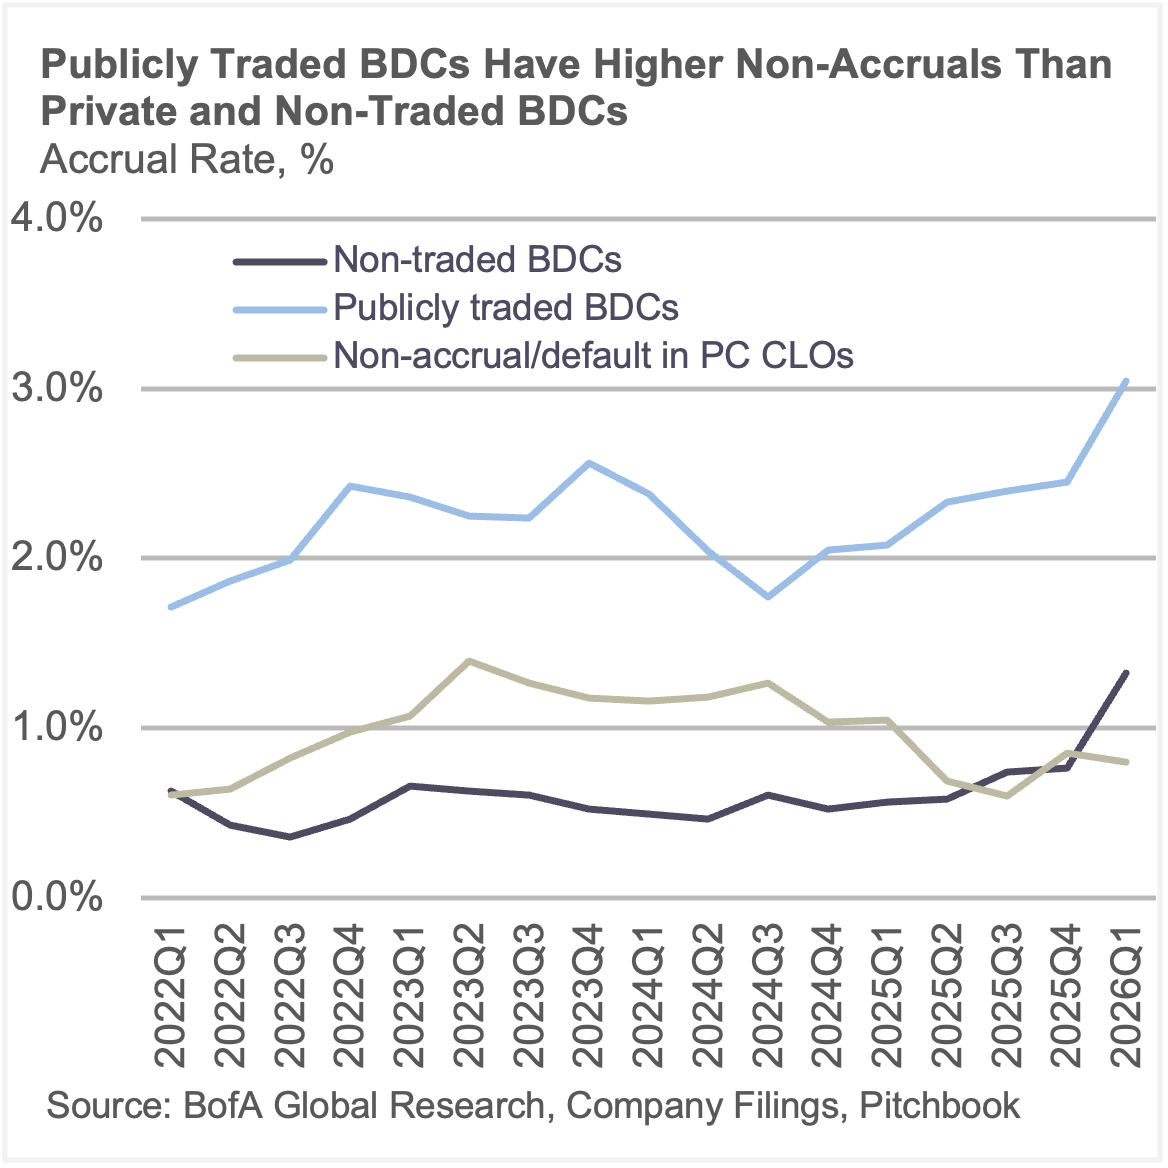
3. Projected Defaults. The direct lending default rate is one of the most quoted and least comparable statistics in the market. Non-accrual rates capture only payment defaults and currently run around 2-2.5% across the BDC universe. Count-based measures that include restructurings, PIK conversions, and liability management exercises reach 6%; on a notional-weighted basis — the closest analog to how BSL defaults are reported — that narrows to roughly 3%. The range is not analytical disagreement; it is methodological. What it obscures is the dispersion underneath: some platforms are running near-zero non-accruals, others are in double digits. Manager selection is key.
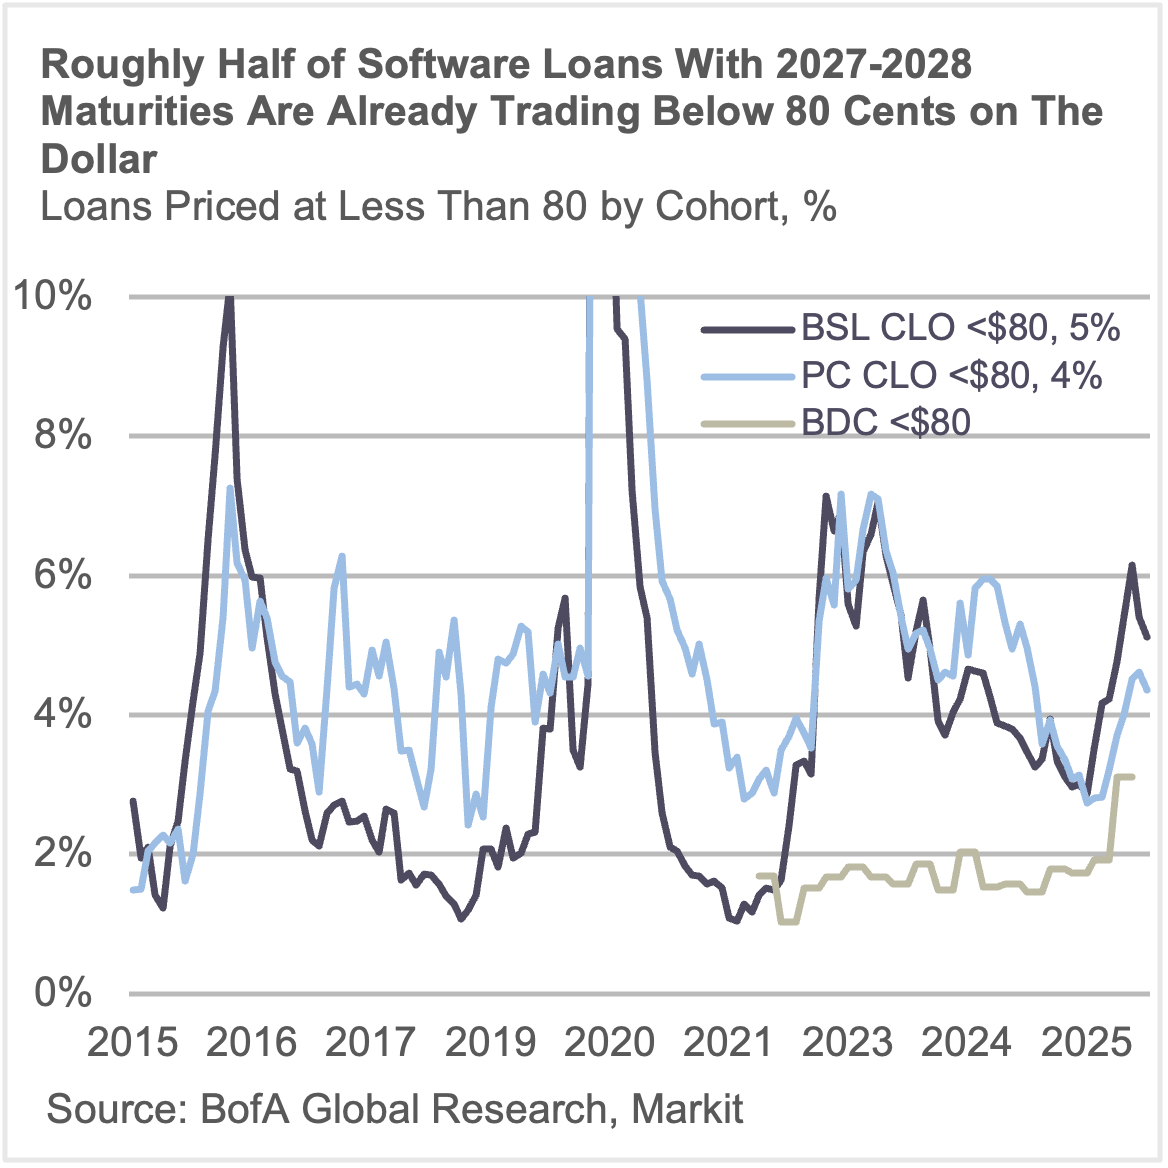
4. BSL Prices Below 80. Roughly half of software loans with 2027-2028 maturities are already trading below 80 cents on the dollar. But the price signal is distorted. CLO managers with high software concentrations appear to be selling their strongest names — enterprise and compliance-critical software still trading near par — to reduce headline exposure. Good and bad credits are being sold together, and the market has not fully separated them. Horizontal application software with limited switching costs faces genuine AI displacement risk; vertical and enterprise software embedded in compliance-critical workflows carries switching costs that make near-term displacement unlikely regardless of AI capability.
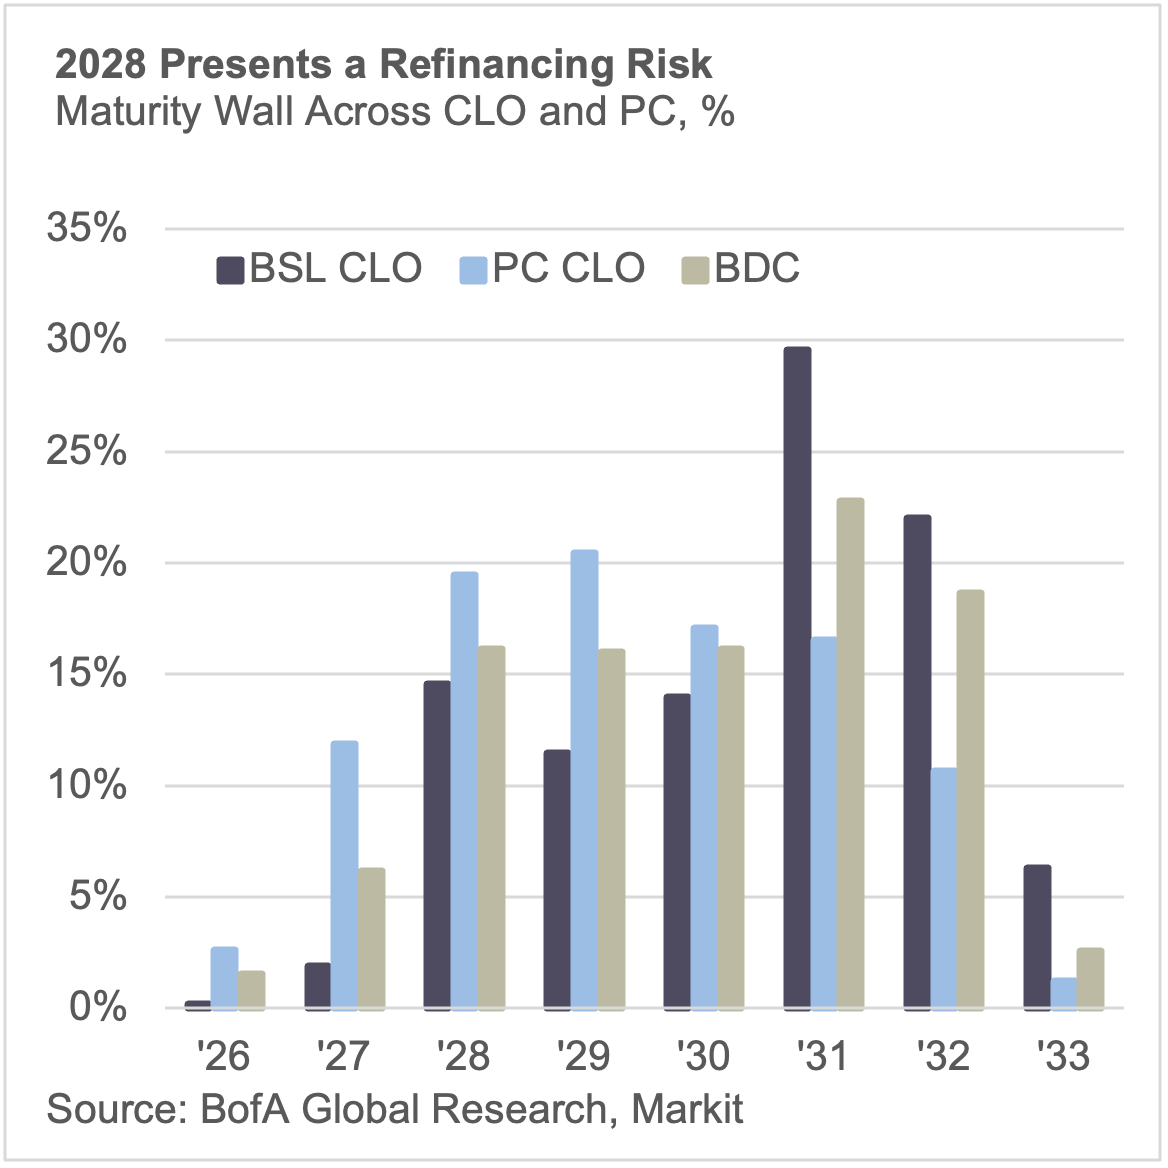
5. The Wall of Maturities. The market entered 2024 with roughly $430 billion of loans maturing in 2028. Approximately $230-250 billion remains — and what is left is disproportionately there because it could not refinance when conditions were more favorable. Software is about $50 billion of that total, but the broader 2021 vintage problem is larger, underwritten at then prevailing low rates. Conservative estimates put potential bankruptcies at $50 billion; a more adverse scenario reaches $100 billion, depending on sponsor support and how quickly AI impacts revenue in exposed sectors. For credits that are over-levered but still generating real free cash flow, the emerging playbook involves lenders mandating amortization — structuring new facilities to pay down principal rapidly enough that the refinancing risk window closes before the maturity date arrives. That works when lenders have the leverage to impose it, which is precisely where bilateral private credit has a structural advantage over broadly syndicated paper.