Non-Traded BDC Redemptions: What the Headlines Missed
The Rithm Take
Bottom Line: Retail private credit redemption requests hit 13.6% of NAV in 2Q26, but actual NAV impact was only 2.0%. Redemption gates, subscriptions, Dividend Reinvestment Plans (DRIP), and positive returns absorbed roughly 85% of the headline request. Nothing in the data or flows points to forced asset sales. This is a contained product-structure story, not a systemic stress event.
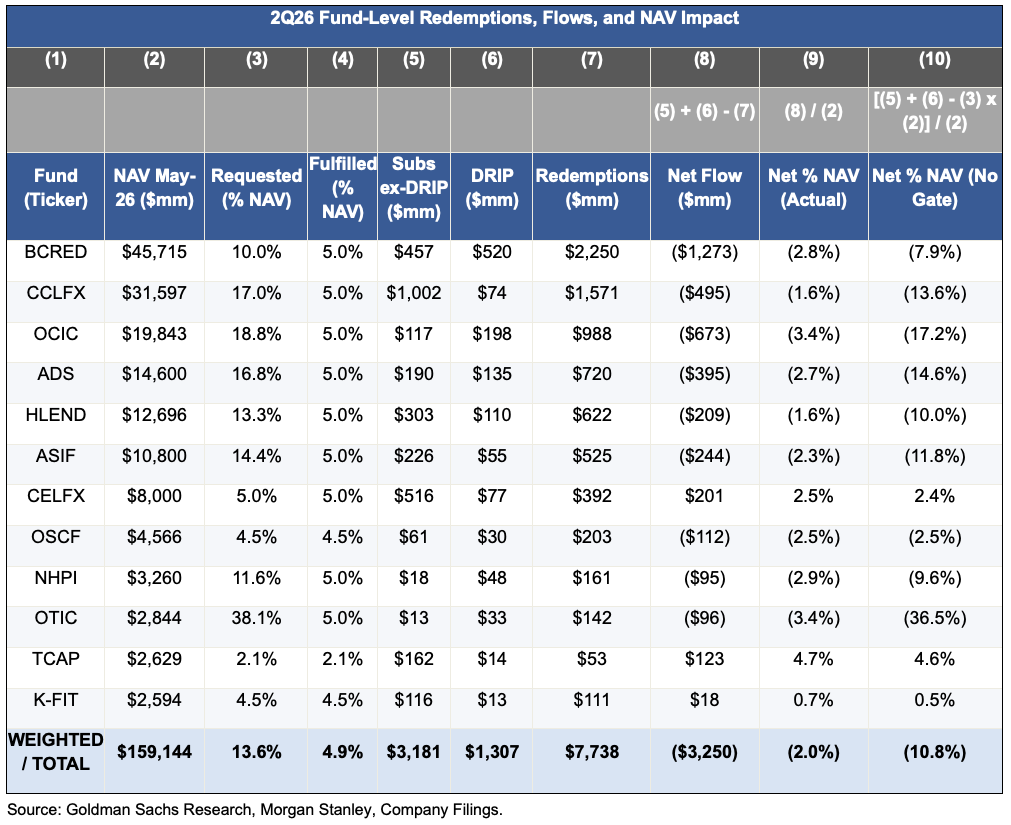
Retail private credit requests accelerated sharply in 2Q26, with 12-fund cohort redemption requests rising to 13.6% of NAV (3), up from 12.1% in 1Q26 and just 2.6% a year earlier. Morgan Stanley separately estimated roughly $12bn of industry-wide requests in the quarter. Despite the acceleration in requests, industry NAV moved only 2.0% lower (9).
The 13.6% figure (3) is investor intent. The 2.0% figure (9) is what actually happened to the balance sheet. Roughly 85% of the requested outflow never left the funds.
Four mechanisms explain the difference. The 5% quarterly redemption gate bound at 8 of the 12 funds in this cohort, capping fulfilled redemptions at 4.9% of NAV (4) even as requests ran close to three times that. Dividend reinvestment (6) kept a meaningful share of distributions inside the funds rather than converting to cash. Gross new-asset generation, while down sharply from a year ago, stayed positive, running roughly 7% annualized ex-DRIP on a June run-rate basis, closer to 9% including DRIP, against north of 30% a year earlier. And trailing investment returns, mid-single digits to low double digits across the cohort per Goldman Sachs Research data, kept compounding NAV even as the queue built.
Together, subscriptions (5), DRIP (6), and returns absorbed roughly $18.4bn of the $21.6bn in requested outflows, calculated as Requested % (3) times NAV (2), summed across the cohort, less the Net Flow (8).
This matters for the forced-seller thesis. The gate structure is the mechanism that prevents this from becoming an asset sale story. A fund facing high-teens redemption requests (3) is not forced to liquidate that share of its book in a quarter. It liquidates at most 5% (4), funded first by subscriptions (5) and DRIP (6) before touching the portfolio. That is a design feature of these vehicles, not an accident, and it is why redemption headlines have consistently overstated the pressure on NAV and on the underlying assets themselves. Nothing in the current data points to funds being pushed into distressed sales to meet redemptions.
This is not 2008. Money market funds broke the buck that year because investors expected instant, at-par liquidity that the funds could not deliver once asset values fell. Non-traded BDCs carry no such promise. The 5% quarterly gate is disclosed upfront, and it is the mechanism doing the work here, not a stopgap improvised under stress.
Dispersion across funds is worth tracking, but it looks different fund by fund rather than industry-wide. One fund saw 38.1% of NAV requested (3) against the same 5% cap (4). Without the gate, that fund would have absorbed a 36.5% NAV decline in a single quarter (10); with it, the actual impact was limited to 3.4% (9). On the other hand, a handful of smaller, higher-returning funds took in net inflows this quarter without hitting the gate at all.
Across the cohort, net NAV impact ranged from a gain of 4.7% at the best-positioned fund to a decline of 3.4% at the most-pressured one (9), a wider spread than the industry-wide 2.0% average implies. That dispersion reflects differences in subscription activity, DRIP participation, and how close each fund sat to its redemption gate, not a single, uniform story across the cohort.
The headline number and the balance sheet number are not the same thing, and confusing them has driven a narrative of systemic stress that the fund-level data does not support.