Real Assets in a Crowded Market
The Rithm Take
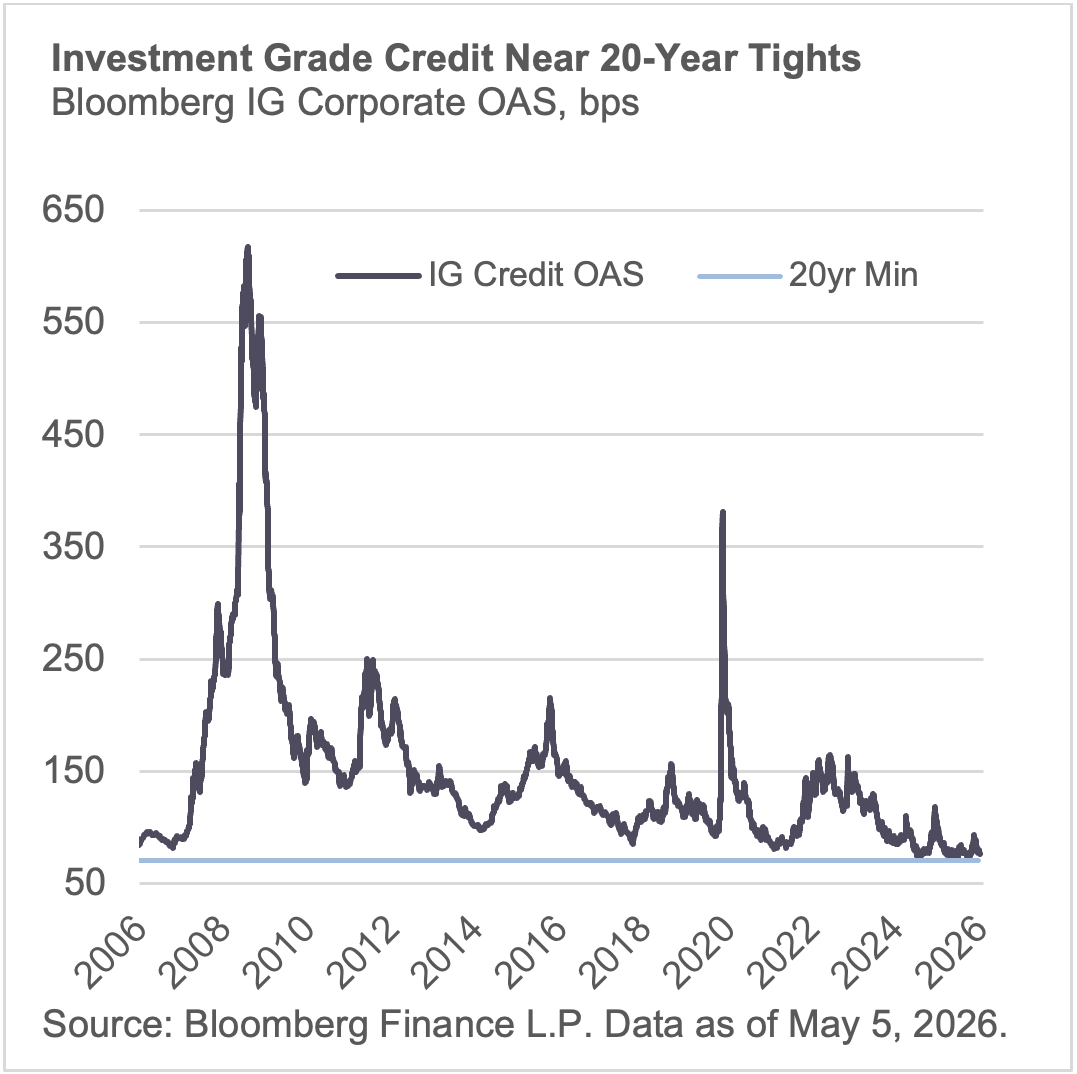
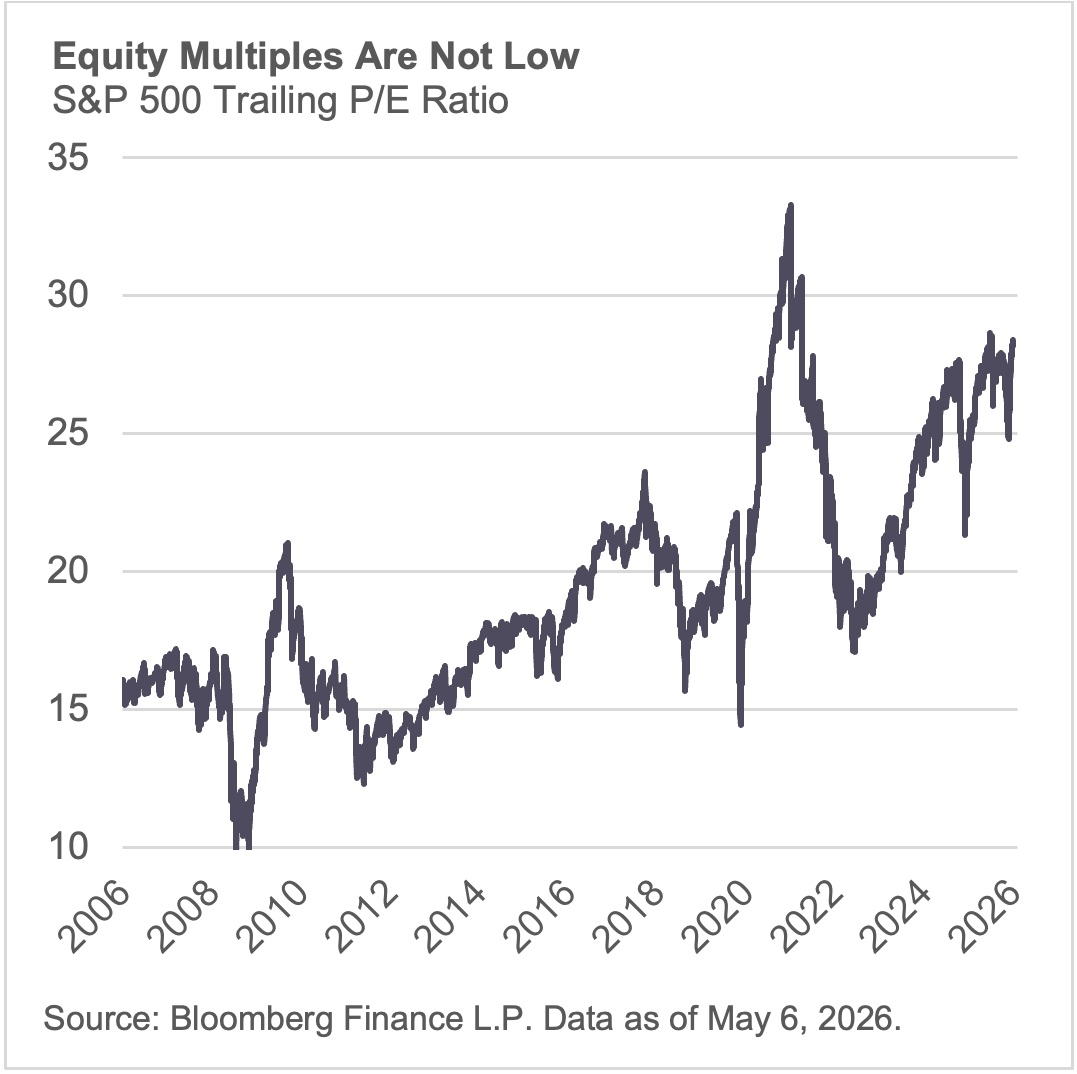
Markets feel frothy. Investment grade corporate spreads sit near the first percentile of tightness over the past five years. The S&P 500 trades at elevated forward multiples with concentration risk still acute. Capital has crowded into the same trades.
Real estate has not participated. The sector was repriced harder and earlier than anything else post-pandemic, and investor positioning still reflects that. But the fundamentals have moved on.
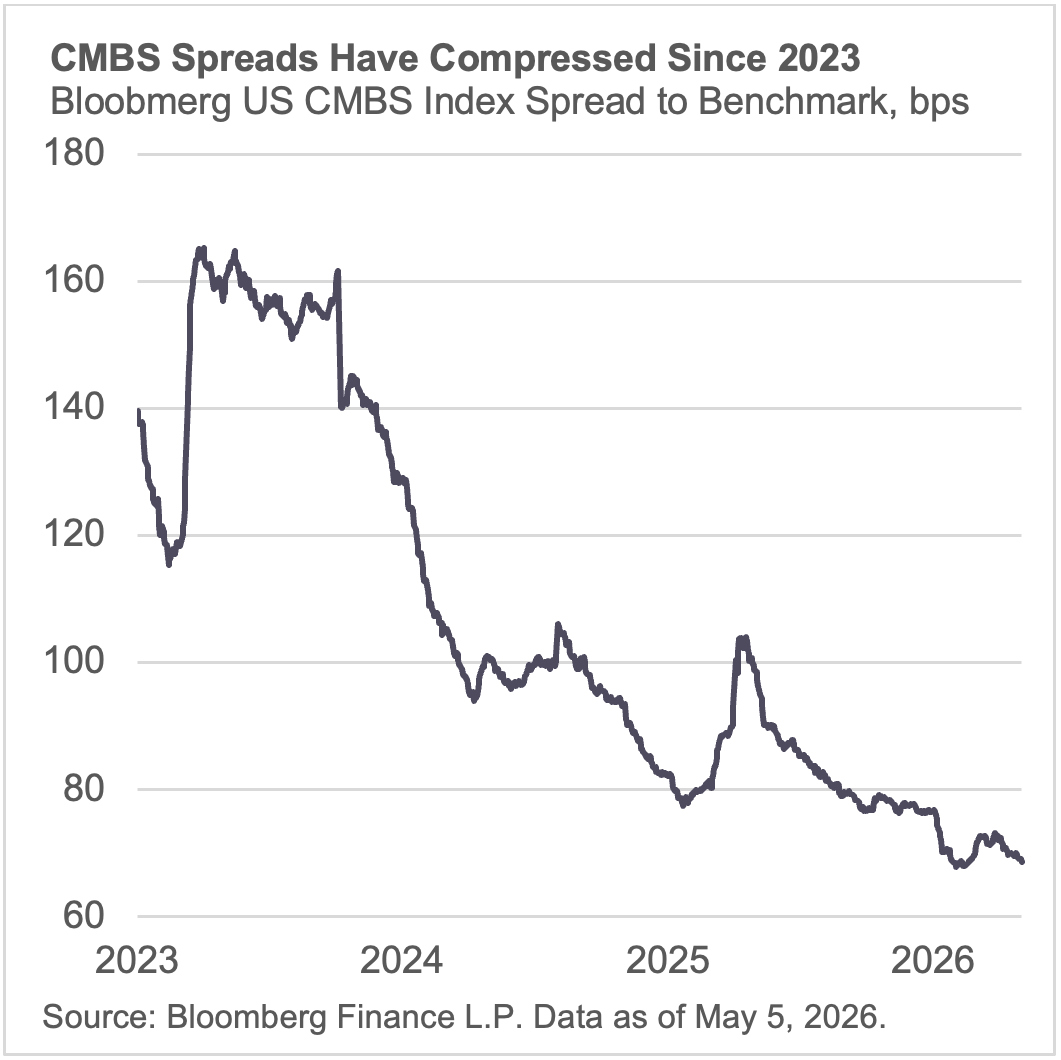
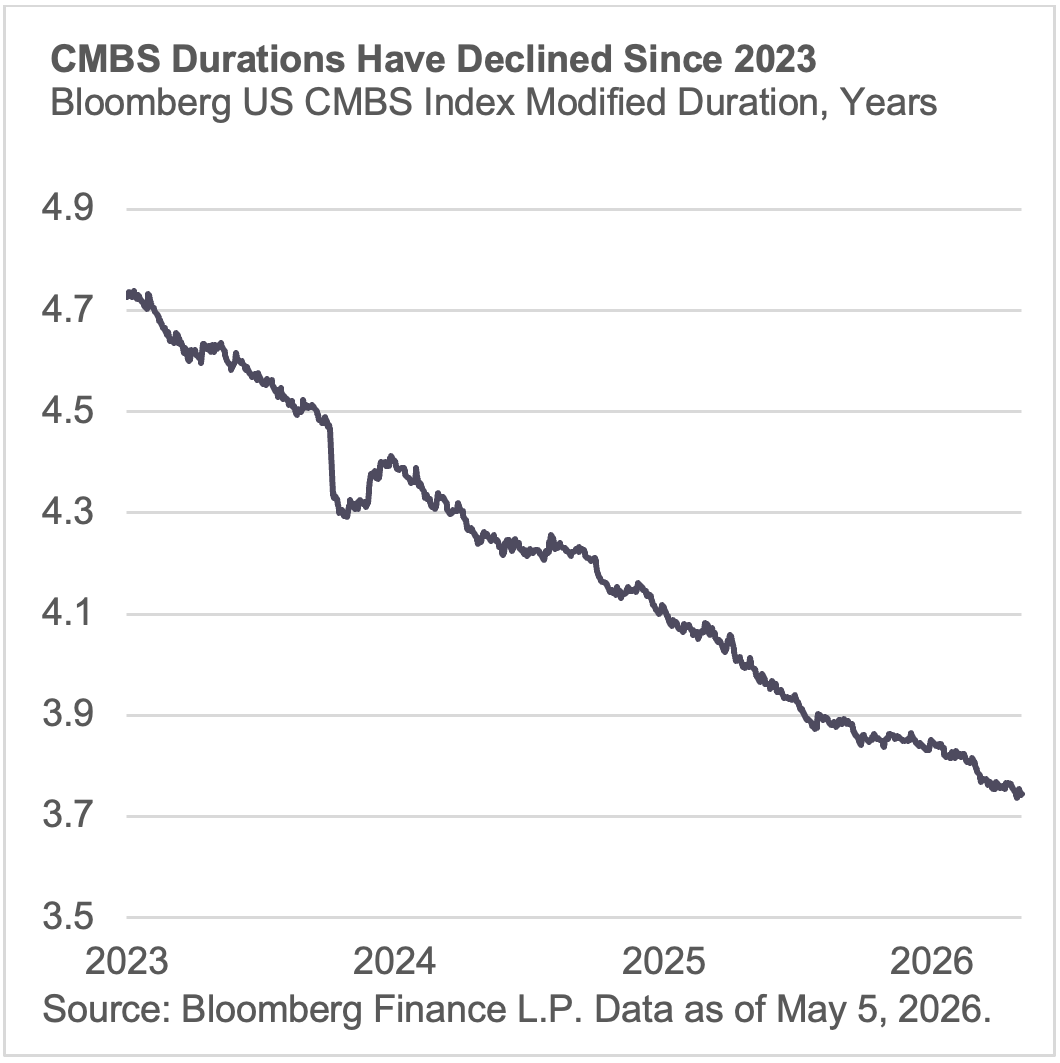
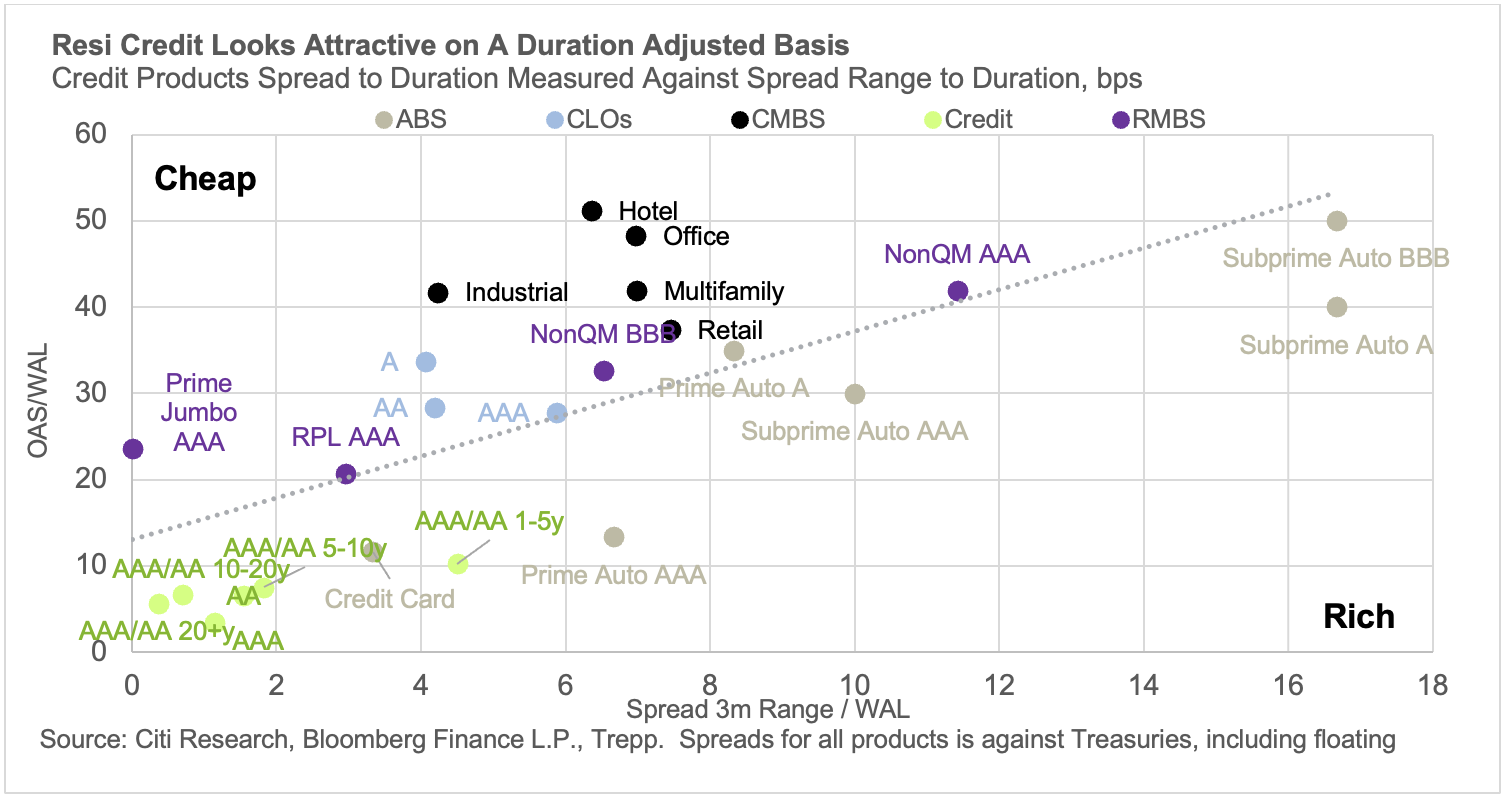
CMBS spreads have tightened from 160+ basis points in 2023 to below 70. But duration across the CMBS stack has shortened meaningfully as loans have been originated at shorter terms with higher coupons and a greater share of floating-rate issuance. Spread per unit of duration is materially better than corporate credit, where the opposite is happening: issuers are terming out debt at the long end, including massive AI infrastructure issuance from hyperscalers that is extending index duration and adding supply into an already tight market. Corporate credit is getting longer and more crowded. CMBS is getting shorter.
Residential credit tells a similar story, though with important nuance. The national mortgage delinquency rate sits at 3.35% as of March 2026, still below pre-pandemic levels, and mortgages remain the most stable category of consumer debt relative to credit cards and auto loans. Roughly two-thirds to 70% of outstanding mortgages carry rates at or below 5%, constraining housing supply and giving most borrowers little reason to sell, refinance, or default. Agency MBS spreads remain wider than pre-pandemic levels despite GSE purchases, and non-agency RMBS backed by seasoned collateral with clean pay histories and low current LTVs offers spread and structural protection that corporate credit at comparable ratings does not.
Office has been the consensus short for three years, and investor sentiment has lagged the fundamental recovery by at least twelve months. Manhattan leasing hit nearly 40 million square feet in 2025, the highest since 2019. San Francisco led major markets with a 41% year-over-year increase in leasing volume, driven by an AI tenant pipeline roughly 8 million square feet deep. Supply nationally is the most constrained in over a decade. The sector that absorbed the most violent repricing post-pandemic is now in a gap between positioning and fundamentals.
Bottom Line: Corporate credit faces a wall of supply from AI-driven issuance, extending duration and compressing spreads further into historically tight territory. Real estate credit is moving in the other direction: shorter duration, recovering fundamentals, wider spreads per unit of risk, and structural tailwinds from locked-in borrowers and constrained supply. Markets are debating bubbles in financial assets, but the value may be in physical ones.
Market Signals
1. Corporate credit is getting longer and more crowded. CMBS is getting shorter. Hyperscaler debt issuance to fund AI infrastructure is adding duration and supply to investment grade indices already at cyclical tight spreads. CMBS duration has compressed as post-pandemic origination has skewed shorter and floating-rate. Spread per unit of duration favors CMBS over comparably rated corporates. The supply-demand dynamic is diverging: more paper chasing tight spreads in corporates, less supply and recovering fundamentals in real estate credit.
2. Residential credit is anchored by structural lock-in. Roughly two-thirds to 70% of outstanding mortgages carry rates at or below 5%. Borrowers are not moving, not defaulting, and not refinancing. That constrains housing supply, supports prices, and limits credit losses across the RMBS complex. Agency MBS spreads remain wider than pre-pandemic levels. Non-agency RMBS with seasoned collateral, clean pay histories, and low current LTVs offers spread and protection that corporate credit at comparable ratings does not.
3. Office is recovering where it matters most. Manhattan leasing hit nearly 40 million square feet in 2025, the highest since 2019. Availability has fallen to roughly 15.5%, down 300 basis points year-over-year, with net absorption exceeding 13 million square feet. Office-backed SASB issuance out of Manhattan hit $17.2 billion in 2025 as capital markets re-engaged at disciplined levels. San Francisco is earlier cycle but accelerating: a 41% year-over-year increase in leasing volume, an active tenant pipeline of roughly 8 million square feet with 85% driven by AI companies, and over 140 executed AI-related deals with more than half by tenants new to the market. Manhattan is core and recovered. San Francisco is momentum.
4. Office supply is constrained and shrinking. U.S. office construction has fallen to roughly 14 million square feet nationally, with 2025 completions the lowest since 2012. Roughly 80+ million square feet of inventory is slated for conversion or demolition. At the premium end, supply elasticity is limited and getting more so.
5. Data centers warrant closer scrutiny. Data center SASB CMBS issuance surged from $3 billion in 2024 to $11 billion in 2025, and the asset class is absorbing capital at a pace unlike anything else in real estate. Roughly 100 GW of new capacity is projected globally by 2030, doubling what exists today. The demand drivers are real, but so are the unknowns. Committed supply has grown six times since 2019 while live capacity has not kept pace. Of 16 GW slated for 2026, only 5 GW is under construction. Tenant concentration is high, with most hyperscale CMBS deals leased to one or a small number of counterparties. Technology cycles introduce obsolescence risk that traditional real estate does not carry: cooling systems, power density requirements, and chip architectures are evolving faster than buildings can be delivered. None of this means data centers are mispriced. It means the sector carries a different risk profile than the rest of real estate.