Where housing levers are turning?
The Rithm Take
In this Rithm Take we introduce a quarterly coverage on housing dynamics. Even with activity levels suppressed and price trends flat, weak homebuilder sentiment, shifts are occurring within regions, on the policy front, compositionally within homes built and mortgage products and strategic shifts by homebuilders.
Top Takeaways
- Monthly payment limits are defining the response to poor affordability -— builders are shrinking homes and buying down rates, while borrowers are shifting into FHA ARMs to hit a monthly payment target.
- The builder affordability trade and the FHA ARM channel are the same story from two angles: incentive dollars are migrating toward adjustable-rate paper, concentrated in Florida/Texas where spec inventory is heaviest.
- Washington is an active variable, not a backdrop — the ROAD to Housing Act, the trigger-lead ban, and a still-undecided GSE IPO are all live policy threads with direct implications for supply, servicer economics, and MSR/MBS spreads.
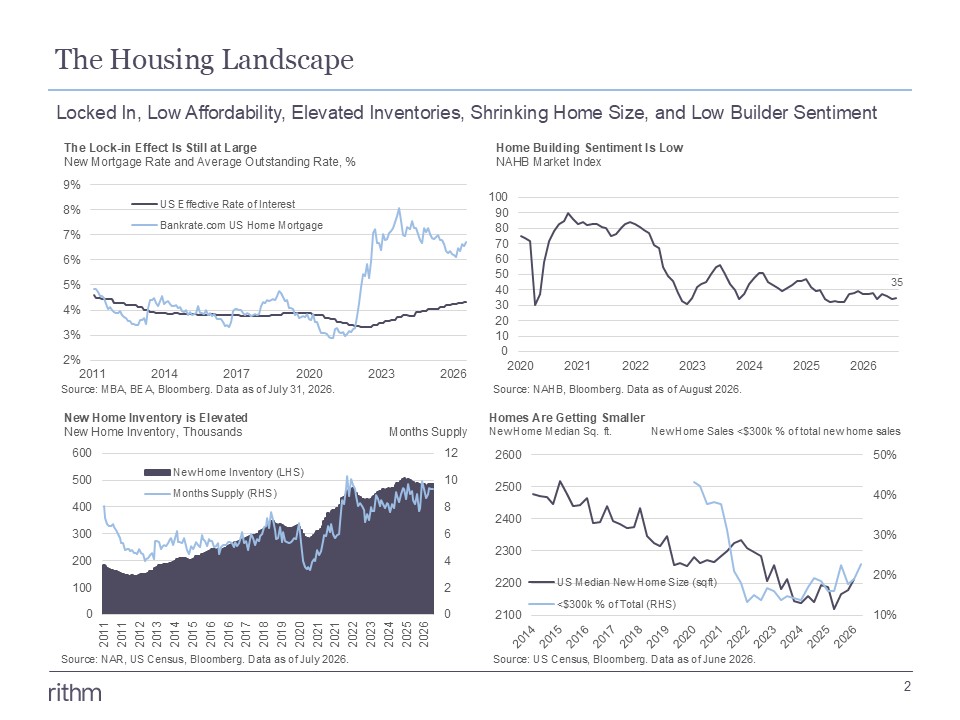
The Housing Landscape
Locked-in rate holders, stretched affordability, elevated inventories, shrinking home sizes, and soft builder sentiment define the current housing backdrop.
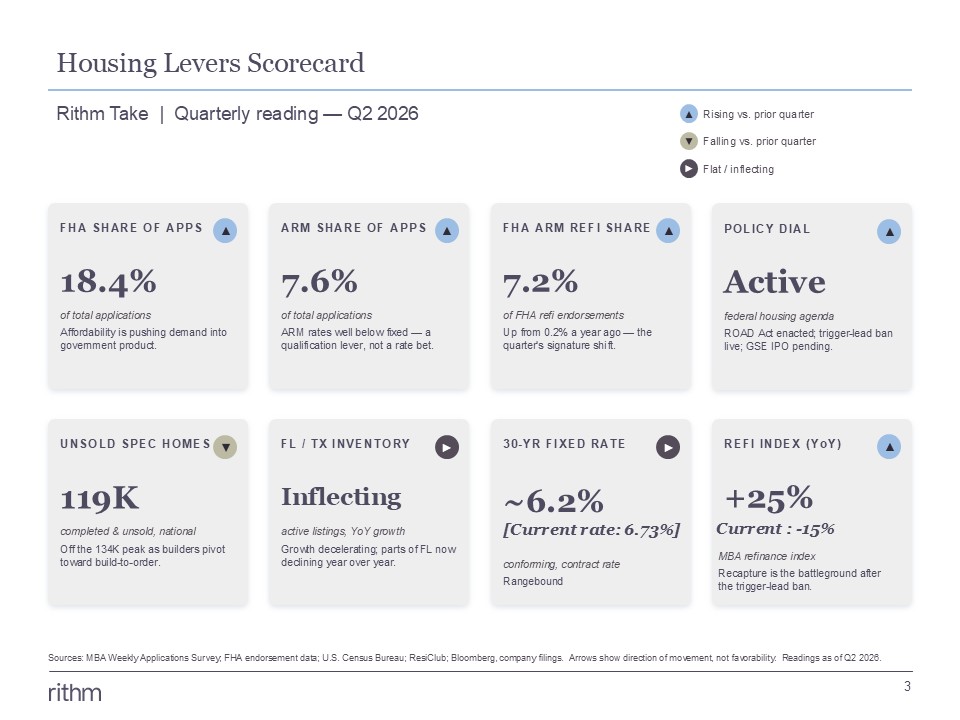
Housing Levers Scorecard
A quarterly dashboard of the key demand, supply, and policy signals — from rising FHA and ARM application share to easing spec inventory — showing an affordability-constrained market still rangebound on rates.
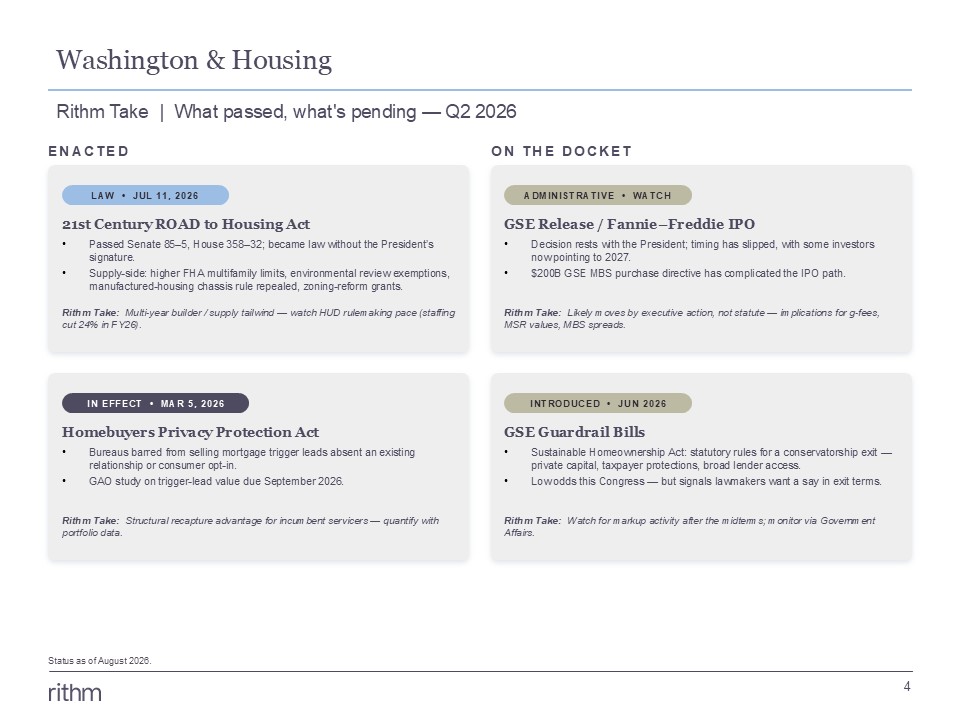
Washington & Housing
A rundown of where federal housing policy stands: the ROAD to Housing Act is now law, the trigger-lead ban is in effect, and the GSE IPO remains a wildcard awaiting executive action.
U.S. Homebuilders: Thematic Takeaways
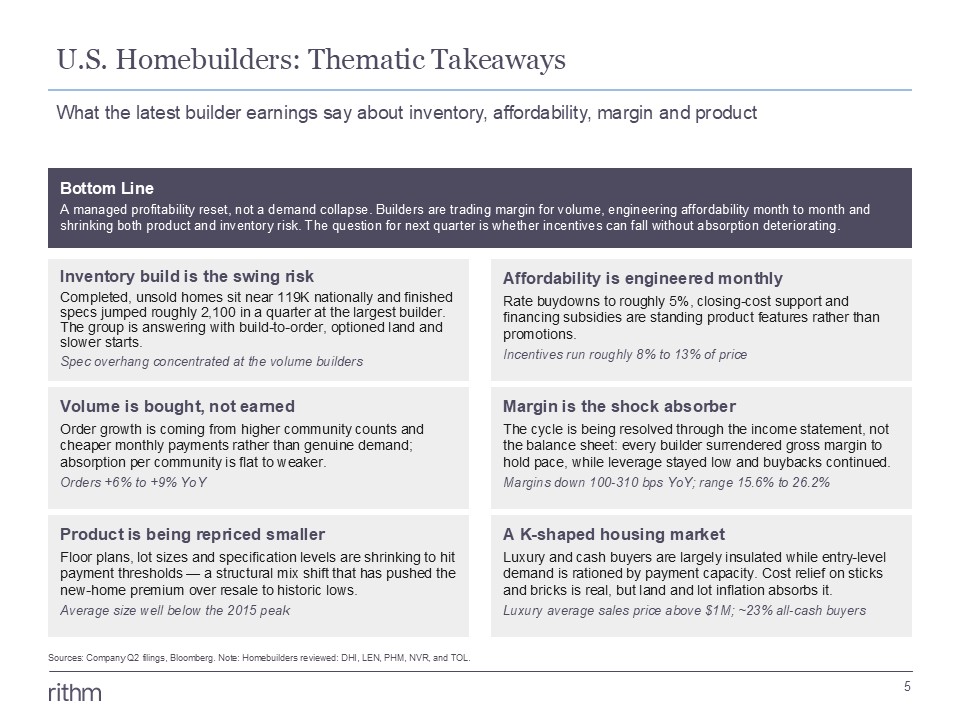
Builder earnings point to a managed profitability reset rather than a demand collapse, with margin absorbing the affordability squeeze as product shrinks and incentives climb toward 8–13% of price.
From Builder Affordability Levers to the ARM Channel
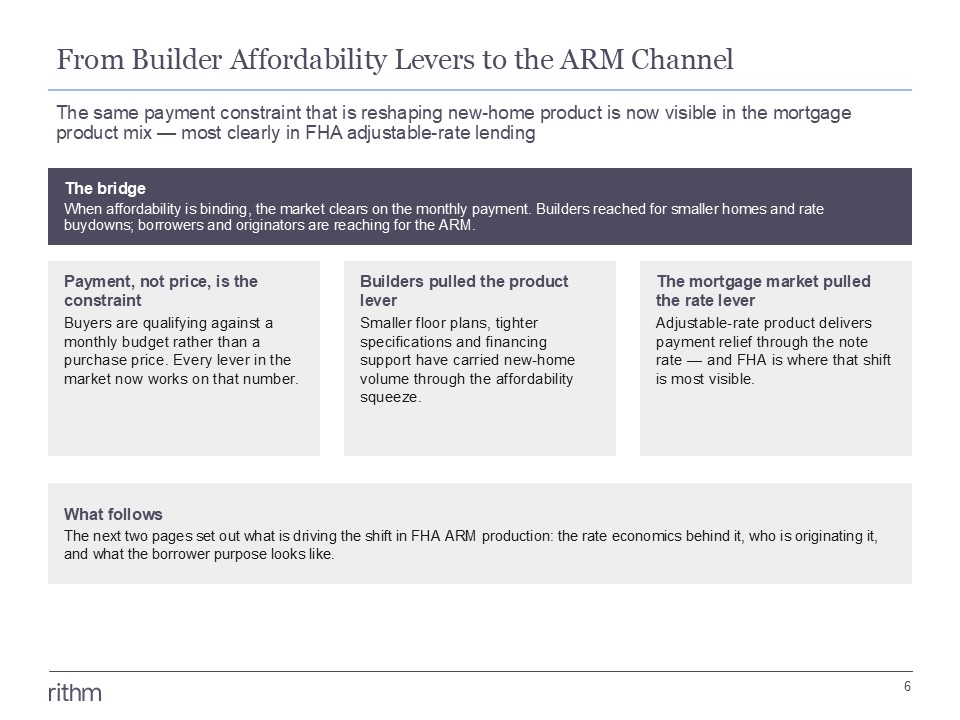
The same payment constraint reshaping new-home product is now showing up in mortgage choice, as builders pull the product lever while originators pull the rate lever through ARMs.
FHA ARMs: A Product-Economics Story
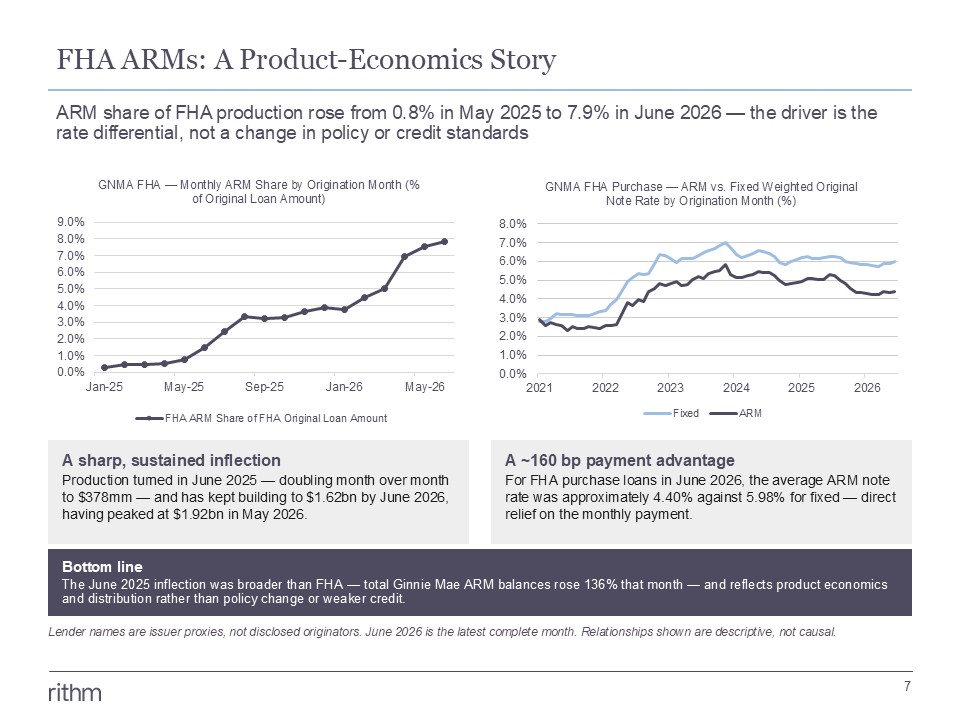
FHA ARM share has jumped from under 1% to nearly 8% of production in just over a year, driven by a roughly 160-basis-point rate advantage over fixed — not by any shift in policy or credit standards.
Builder Finance Sits Inside the ARM Trade
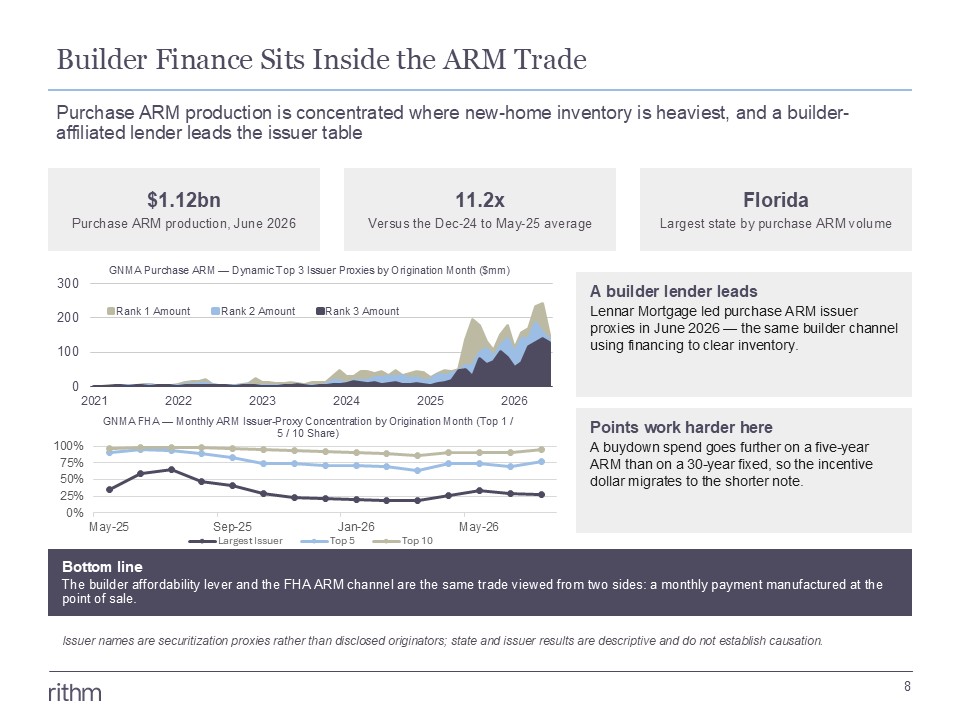
Purchase ARM production is concentrated in Florida and led by a builder-affiliated lender, underscoring that builder incentives and FHA ARM growth are two views of the same payment-engineering trade.
Who Is Originating — and Who Is Borrowing
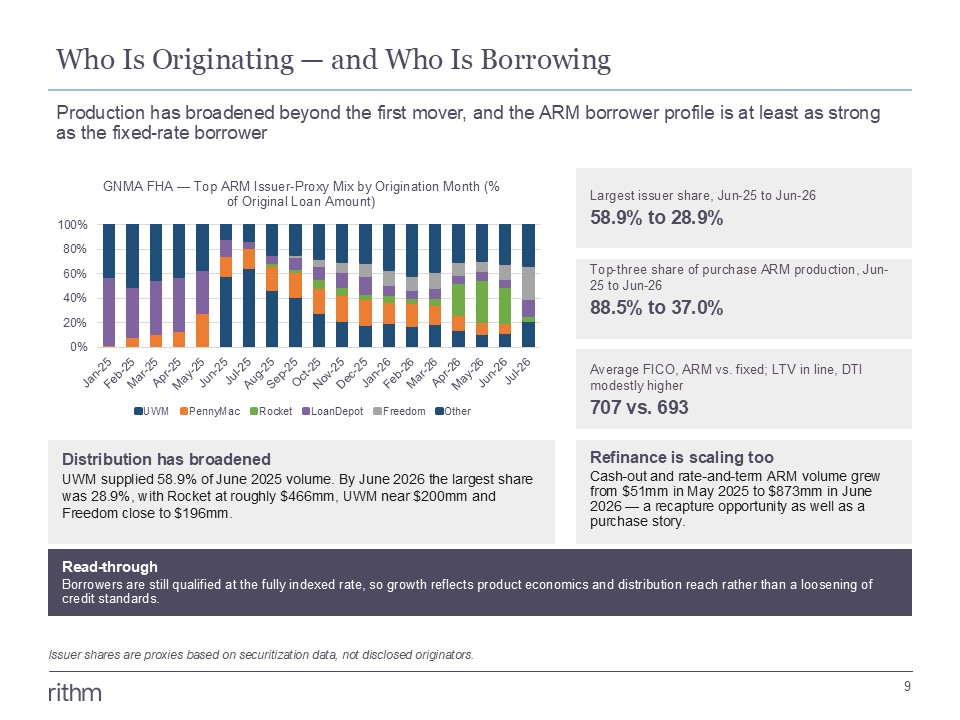
Origination has broadened well beyond the early leader, and ARM borrowers are showing stronger credit profiles than fixed-rate borrowers, reinforcing that this growth is about product economics, not looser standards.
Product Structure and Reset Timing
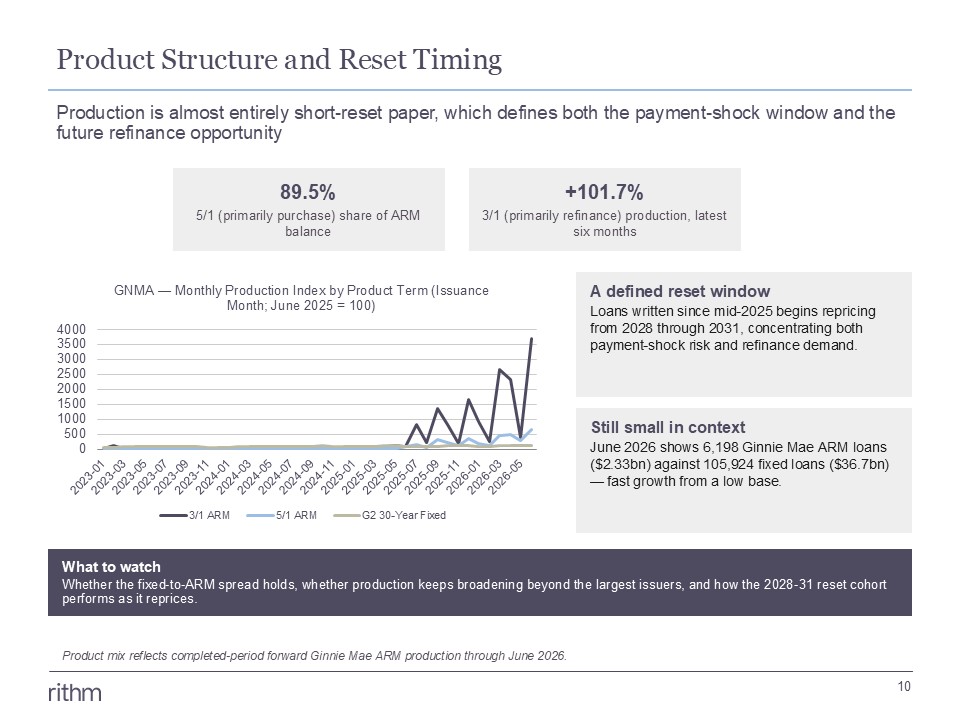
Nearly 90% of ARM balances are 5/1 paper that begins resetting in 2028, setting up a defined window for both payment-shock risk and a future refinance opportunity.
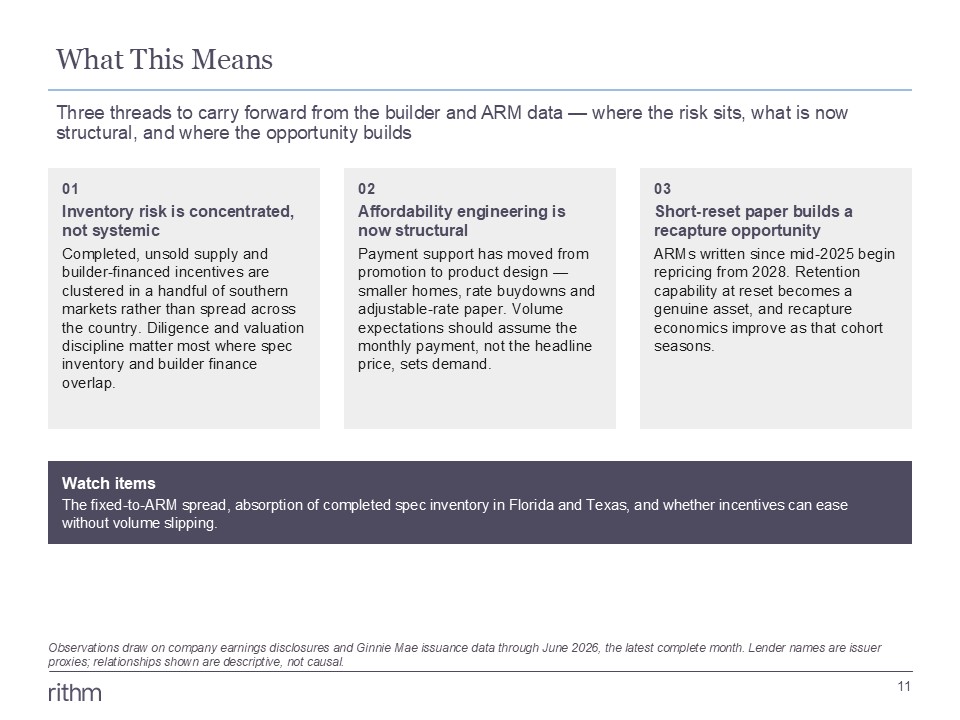
What This Means
Three closing threads: inventory risk is geographically concentrated, affordability engineering is now structural rather than promotional, and short-reset ARM paper is building a recapture opportunity as it seasons toward reset.