How are housing dynamics shaping up?
The Rithm Take
US mortgage rates climbed for a seventh straight week to their highest level in nearly three years, compounding the nation's affordability problem. The 30-year mortgage contract rate reached 7.49% on October 2, the highest print since 2023.
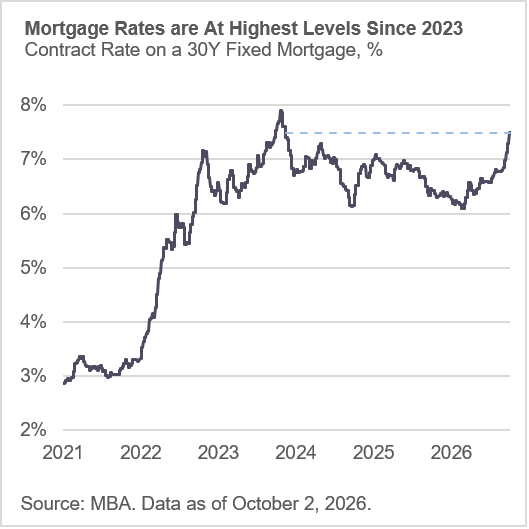
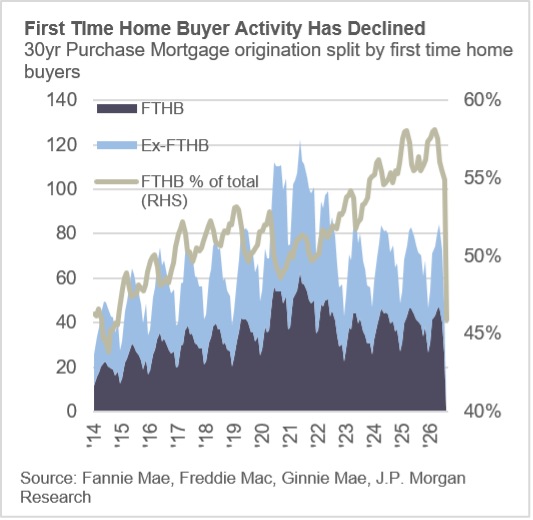
Rates above 7% stand to turn housing squarely into the hands of first-time buyers (FTHB). Repeat buyers sit out because moving means trading a 4.5% mortgage for a 7.4% one, and first-time buyers take up the slack. Lower rates are widely expected to restore balance, but those prospects have diminished. The data say the relief will be uneven, with supply coming back in the Midwest and the large Sun Belt states while the high-cost coastal markets stay largely frozen.
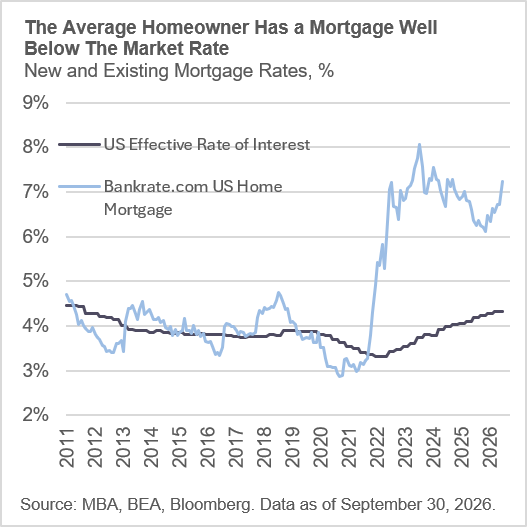
The higher FTHB share is a lock-in story. FTHBs account for 57% of purchase originations backed by Fannie Mae, Freddie Mac, the Federal Housing Administration (FHA) and the Department of Veterans Affairs (VA) in the first half of 2026, up from 51% on average over 2017 to 2022. First-time volume sits 23% below 2021 and repeat-buyer volume sits 40% below, so the share climbs because existing owners left. Half of agency 30-year balances carry coupons of 4% or lower, which means a move costs the average owner roughly 290 basis points.
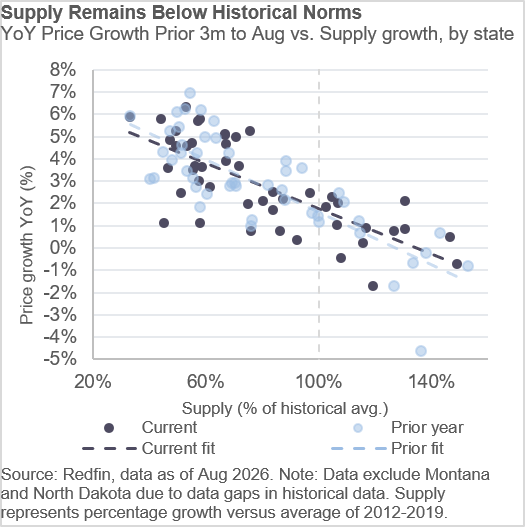
The price data show where this is heading. Weakness sits in Texas, Washington and Oregon, where supply runs above historical norms, while much of the Northeast, California and parts of the Midwest hold appreciation on thin inventory. Texas shows the full set of pressures: FHA funds close to half of first-time volume, shadow supply is among the largest of the big states, supply is well above average and prices are falling. Washington shows that deep lock-in gives way once supply rises. A rate decline adds listings fastest in the Midwest and the Sun Belt, and the Sun Belt is where leveraged first-time demand is least able to absorb them. The Northeast and California keep the support of scarcity. September and October originations are the first data to reflect rates above 7%, and they will show whether the FTHB share holds.
Market Signals
National Home Prices and Inventory
Supply below historical norms keeps national appreciation positive. The softness is concentrated in Texas, Washington and Oregon, where supply runs above average, which puts the price adjustment at the state level and leaves the national trend intact.
Regional Price and Supply Trends
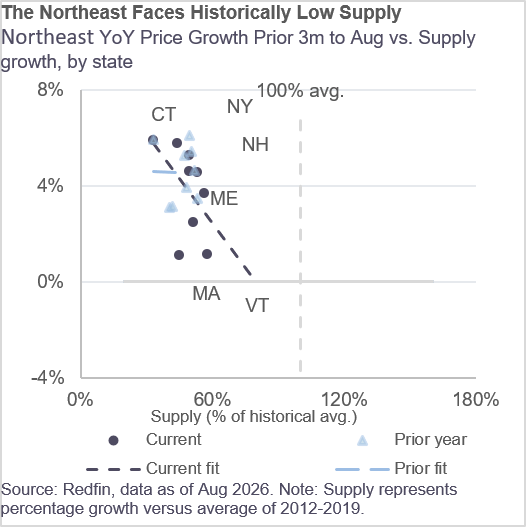
Northeast: Historically low supply still supports appreciation, but the support is thinning. Connecticut retains strong growth, while Vermont has slowed as supply moves closer to its historical level. Prices are becoming more sensitive to supply, even with inventory well below the pre-pandemic average.
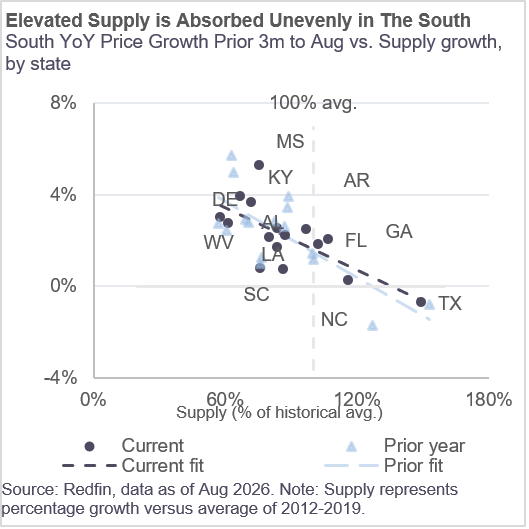
South: Elevated supply is clearing unevenly. Florida's easing supply has come with a return to positive appreciation, Texas still shows falling prices on supply substantially above average, and Georgia's modest growth shows elevated supply capping gains. Stabilization is arriving market by market.
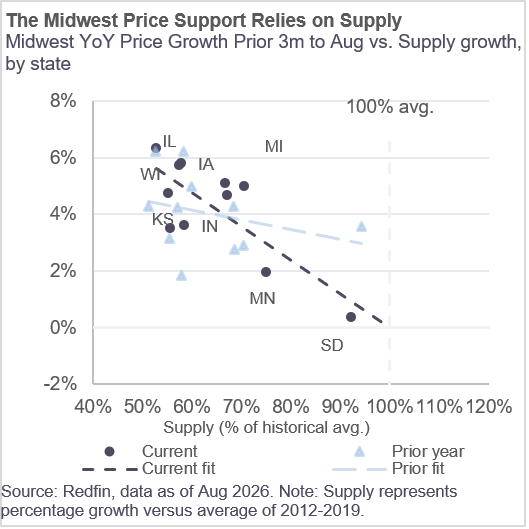
Midwest: Price support depends on how far supply sits below historical norms. Wisconsin retains strong appreciation, while South Dakota is close to flat as supply approaches its historical average. Markets nearer normal supply show much weaker appreciation, so cooling is uneven and prices are responding more to inventory.
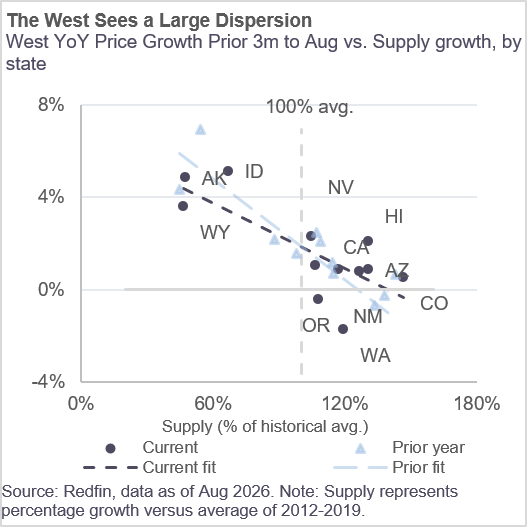
West: Western markets sit at different stages of adjustment. Washington's rising relative supply has come with renewed price declines, while California's falling relative supply has come with a return to modest appreciation. Prices can stabilize before supply returns to historical levels, but persistent weakness in Washington and Oregon keeps the recovery uneven.
First-Time Buyer Volume and Financing by State
Nearly 30% of first-time volume sits in California, Texas and Florida, and the financing behind it differs by region. FHA funds more than 40% of first-time volume in Texas, Florida, Arizona, Nevada and Georgia, against roughly 20% in New York, Illinois, Massachusetts and Connecticut, where Fannie Mae and Freddie Mac fund 70% or more. FHA borrowers put less down and qualify closer to their payment limits, so each rate increase pushes them out of the market sooner than a conventional buyer. Texas and Florida combine large first-time volume with heavy FHA reliance, which makes Sun Belt FHA originations the earliest read on affordability stress. Once originations at rates above 7% enter the data, the FHA share in Texas, Florida and Arizona is the first place the effect shows up.
Shadow Supply and Rate Lock-In
Much has been made of the lock in effect – where potential home sellers do not sell because of the much larger monthly payment they would obtain at higher rates – freezing housing supply. However all geographic markets will not get the same level of housing supply release if rates do drop and lock-ins dissipate. The loosening of supply would have the highest marginal impact in those regions where the most existing mortgages are at or near current mortgage rate, reducing opportunity cost for moving homes.
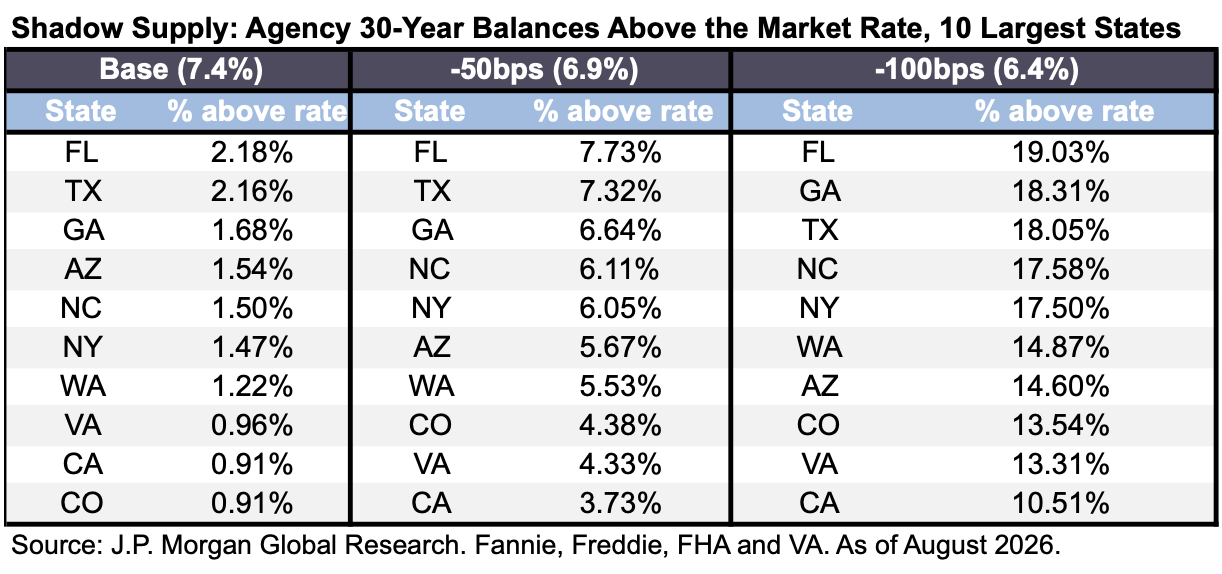
A full point decline to 6.4% leaves 83% of agency balances below the market rate, so national lock-in loosens slowly and unevenly. Indiana and Ohio see 23% to 24% of balances move above market, Florida, Georgia and Texas 18% to 19%, and California 10.5%, where coupons of 4% or lower still fund 63% of balances. The most expensive markets get the least relief.
Owners who stay put borrow against their equity instead of selling. Home equity lines of credit (HELOCs) and closed-end seconds become the release valve, which moves housing wealth into consumer credit and leaves listings little changed. With the path of least resistance for rates higher, most of this shadow supply stays on the sidelines. Midwest supply returns at scale around 6%. At that level one in four agency balances sits at or above market, and more than a third does in Indiana, Ohio, Kansas and Missouri.