What the Mortgage Tape Says About the Consumer
The Rithm Take
The mortgage tape can give insight into the health of the consumer. Every major loan product maps to a distinct borrower profile, and right now each of those profiles is sending a different signal.
The conventional conforming borrower, typically a W-2 earner with strong credit and a fixed-rate mortgage locked well below current levels, is performing as well as at any point in the post-pandemic period. The FHA borrower, often a first-time buyer at the lower end of the income distribution, shows headline deterioration that is almost entirely explained by a regulatory reporting change rather than a shift in payment behavior. The non-QM bank statement borrower, effectively a proxy for the self-employed and small-business operator, has stabilized after a multi-year normalization and is now trending in the right direction.
Read together, the mortgage tape does not describe an economy that is rolling over. It describes an economy where the answer depends entirely on which consumer you are asking about. The prime borrower is locked in. The FHA headline number is misleading. The self-employed borrower is stabilizing. The data do not support a narrative of broadening consumer credit deterioration. They support the view we have held: this is an economy where outcomes depend on which cohort you are underwriting.
Market Signals
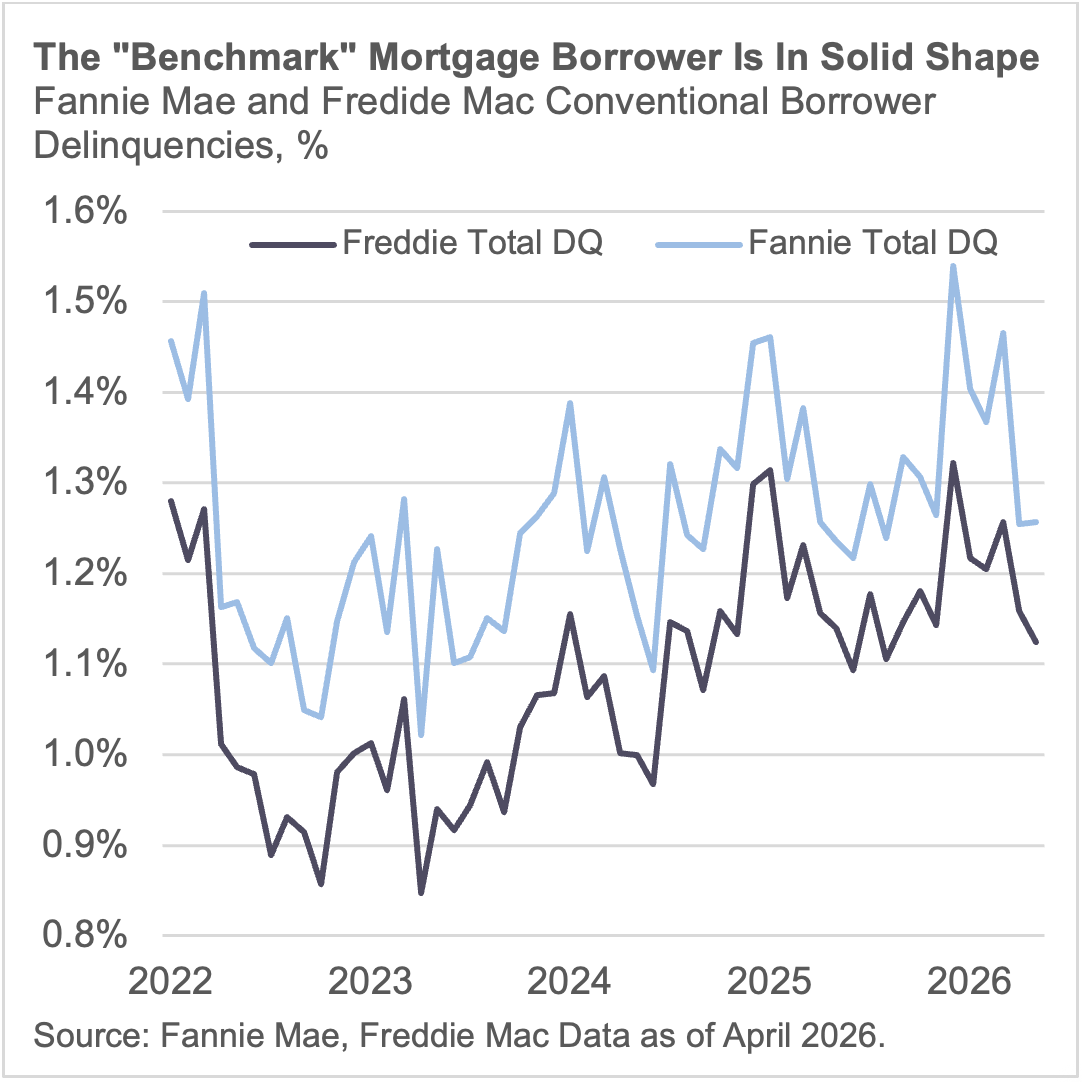
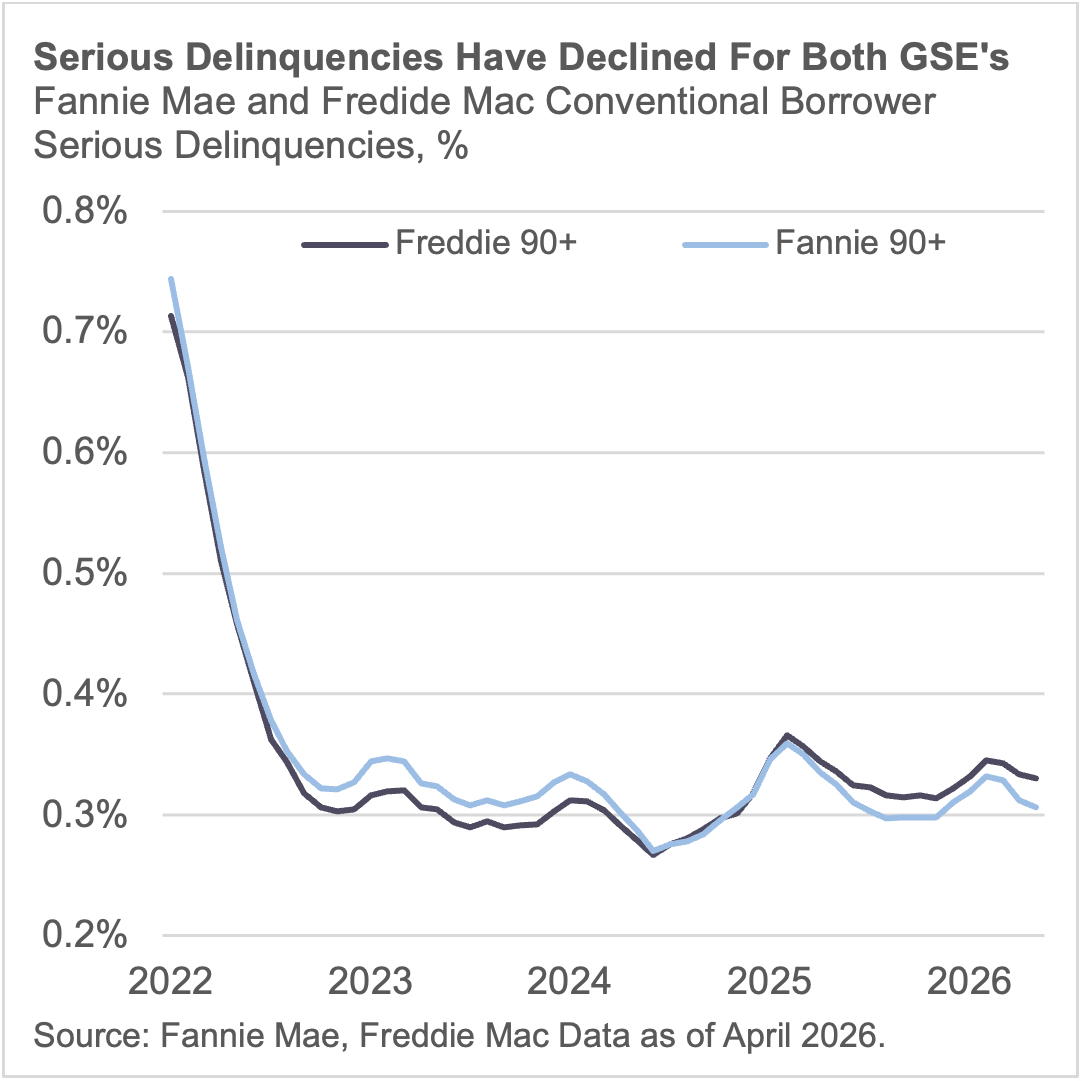
1. The benchmark borrower is well-insulated. The conventional conforming loan is the closest thing the mortgage market has to a control group. These are prime, W-2, agency-eligible borrowers with verified income, strong credit scores, and fixed-rate debt. Freddie Mac total delinquency sits at 1.12%. Fannie Mae at 1.26%. Both are essentially flat year-over-year, with serious delinquency continuing to drift lower. This is the household that locked a sub-5% rate during 2020 or 2021 and has seen nominal income growth compound on top of a fixed obligation. The rate lock functions as a de facto credit enhancement: monthly payments are anchored well below what the same house would cost to finance today, which suppresses default risk and keeps household cash flow in a structurally favorable position. All of this points to the “benchmark” borrower in good shape.
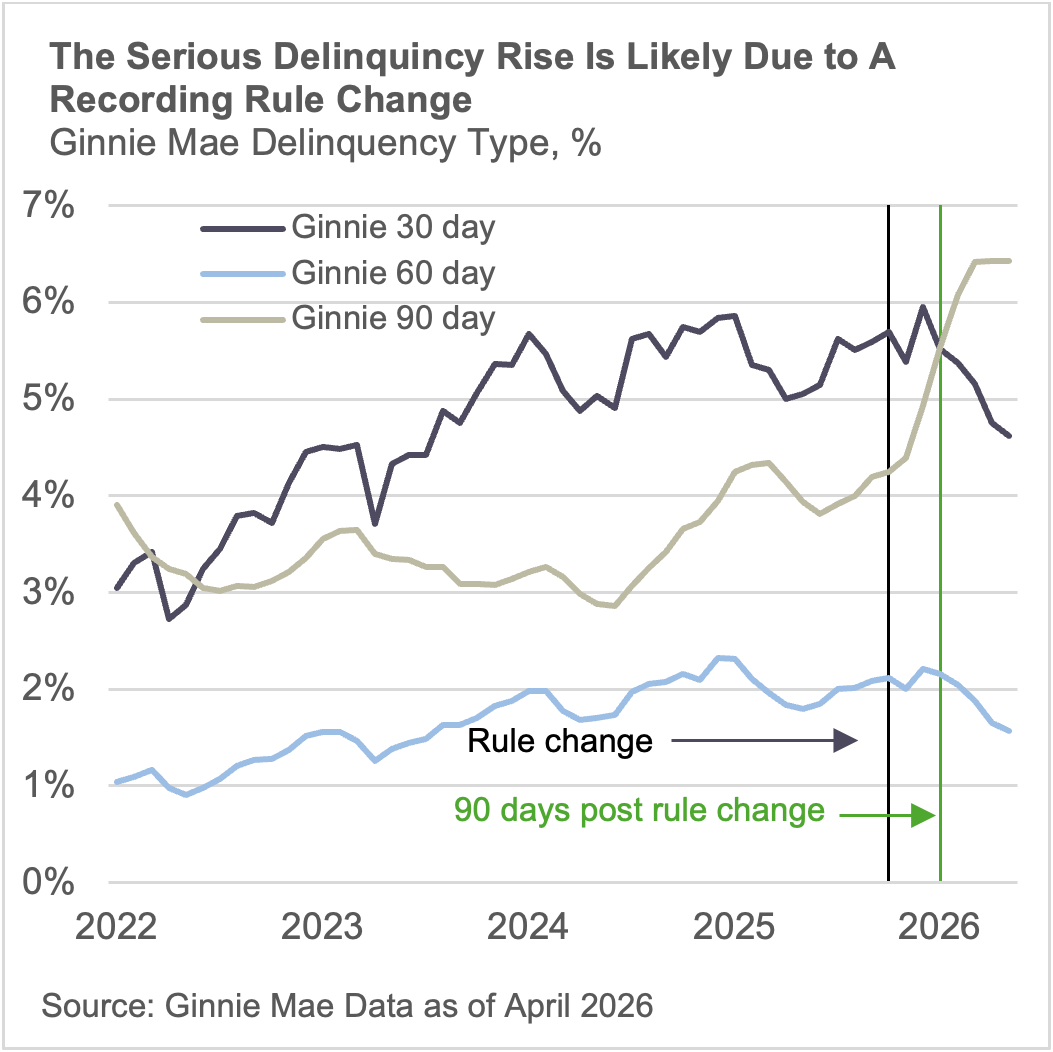
2. The headline stress in government lending represents a rule change. FHA borrowers represent the lower end of the income and credit spectrum: first-time buyers, thinner down payments, higher debt-to-income ratios. This is the cohort most exposed to affordability pressure, and a casual read of the data looks alarming. FHA serious delinquency rose from 4.4% in November 2025 to 6.4% by March 2026 and has held there since. That kind of move, in isolation, would suggest acute borrower stress.
But over the same period, FHA 30-day delinquency dropped from 5.7% to 4.6%, and 60-day from 2.1% to 1.6%. New delinquency formation is improving, not deteriorating. The D90+ spike is driven by a change in how FHA classifies loans in modification trial periods: borrowers who are actively working through loss mitigation are now being reported as seriously delinquent during the trial window, where previously they would have been classified as current or in a workout. The result is a mechanical reclassification of existing workouts into the D90+ bucket, not a new wave of missed payments.
VA lending confirms the read. VA borrowers overlap meaningfully with FHA on income sensitivity and affordability exposure. If the FHA move reflected genuine credit deterioration in the lower-income cohort, VA should confirm it. It does not. VA total delinquency is flat at 4.4%, with D90+ stable near 2.3%. The divergence between FHA and VA is itself the evidence that the FHA number is a reporting quirk.
Any institution holding significant Ginnie Mae servicing or securities is likely to show headline delinquency increases in upcoming reporting. Without context, those numbers will look like portfolio deterioration, but with context they reflect a rule change.
3. The self-employed borrower is stabilizing, not deteriorating. Non-QM bank statement loans are the mortgage market's closest read on the small-business owner and self-employed operator. These borrowers qualify using deposited income rather than tax returns, which means the loan product captures a segment of the economy that traditional employment data misses entirely. Bank statement D90+ peaked at 3.3% in mid-2025 and has since come down to 3.0%. The trajectory has been gradual and sustained, consistent with a borrower base that absorbed the rate shock of 2022 and 2023 and is now seasoning through it rather than rolling over.
DSCR loans, which serve real estate investors qualifying on property-level cash flow, tell a parallel story. D90+ has declined from 2.6% to 2.3% over the same period. These are borrowers whose performance is tied to rental income and occupancy rather than personal wages, and the improving trend suggests that the underlying real estate cash flows are holding.
The Bottom Line: The pattern is internally consistent. The prime, asset-owning, fixed-rate borrower is performing well. The lower-income, first-time buyer is under pressure but the data, once you strip out the reporting change, show manageable stress rather than a step-function deterioration. The self-employed borrower is past the worst and improving. This maps directly to the consumer bifurcation we have described throughout this cycle: higher-income households with equity and rate protection on one side, affordability-constrained borrowers with less cushion on the other, and the small-business owner navigating somewhere in between.