Will Credit Crunch, Squeeze, or Sneeze?
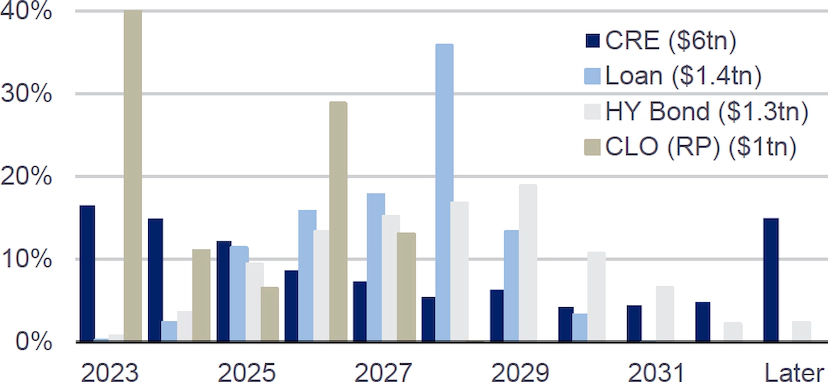
The recession call is growing highly subject to timing (later) and severity (milder), with a growing number of market pundits taking a recession entirely off the table. The timing of this comes alongside rising noise from credit-focused strategists given the looming wall of debt maturities. We see this spanning across sectors – from commercial real estate and high yield to leveraged loans and collateralized loan obligations (CLOs).
Almost a year ago, in an eight-minute mic drop speech at the Kansas City Fed’s Jackson Hole symposium, Fed Chair Jay Powell announced a major shift in the Fed’s monetary policy strategy. When the Federal Open Market Committee (FOMC) began hiking rates in March 2022, various policymakers said that the neutral rate of interest was 2½%, which was the median assessment of committee participants in the longer term, and the strategy was to get back to this level and then assess from there. The problem with this approach was that this was the Fed’s assessment of neutral when inflation was running at the 2% target rate and it was flawed reasoning to use this figure as neutral when assessing what level of interest rates would be needed to get inflation down to 2%.
Economic recession or not, credit cracks point to an intensifying capital recession, symbolized by a forced reallocation of capital from weak to strong hands. Intensifying credit stress signals – such as those identified above – force a repricing of assets to a new fundamental outlook of a higher rate and risk premium regime as new lenders underwrite to tighter standards. The degree of weakening/worsening of these trends will determine the magnitude of what manifests as either a crunch, a squeeze, or perhaps just a sneeze.
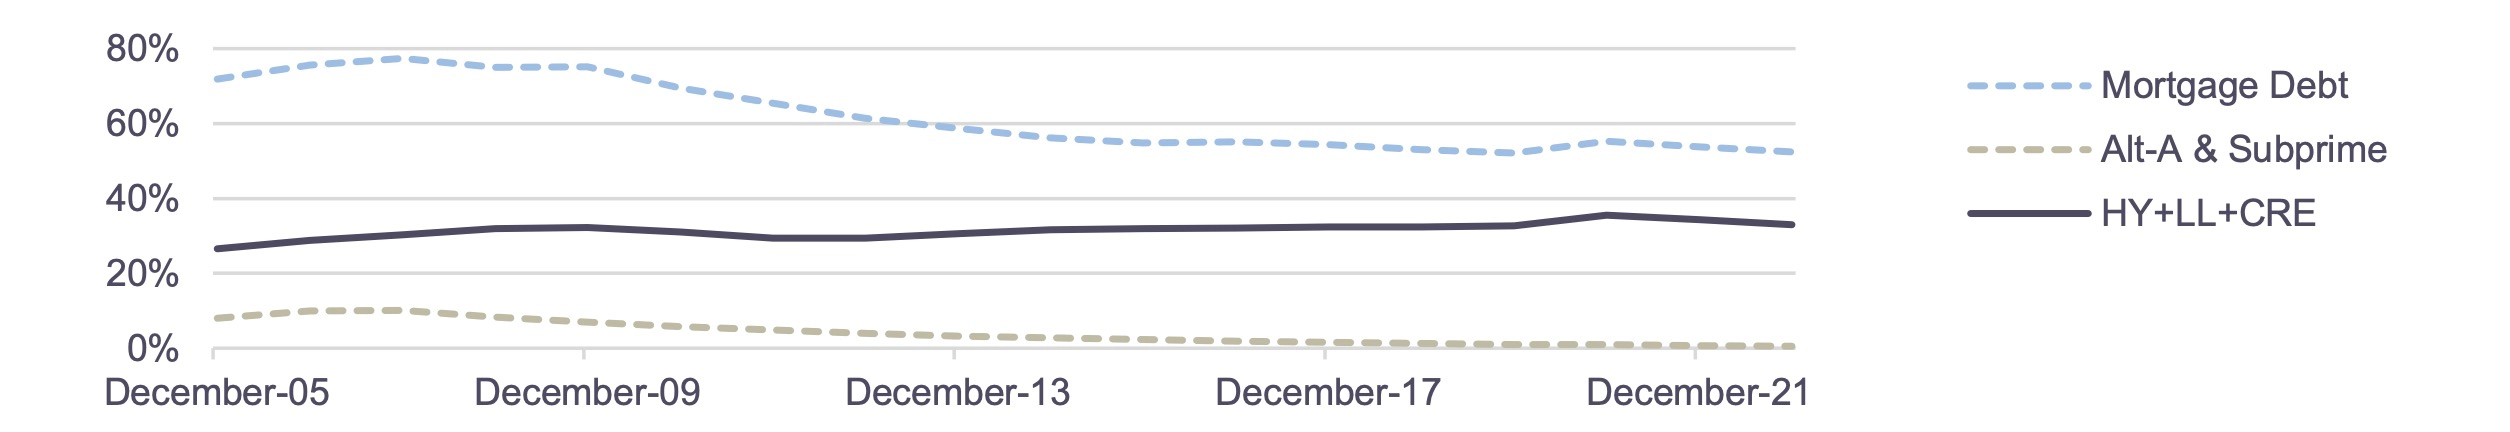
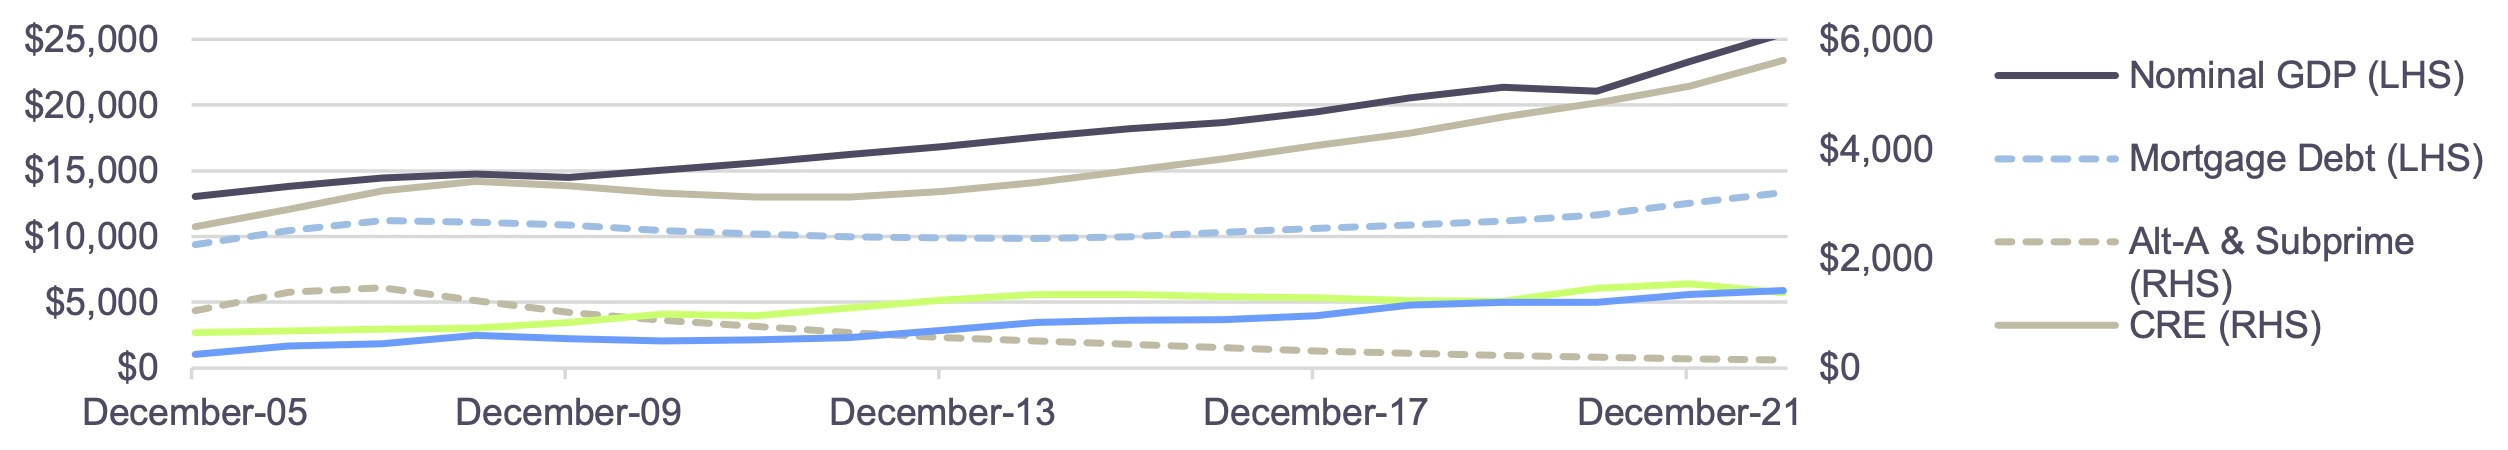
To help put this into perspective, we compare exposure (as a share of nominal GDP) in the credit-exposed sectors today (high yield, leveraged loans and commercial real estate) to that of mortgage debt, particularly weak subprime, and Alt-A back in the mid-2000s. Exposures today are far lower. Total mortgage debt was 80% of nominal GDP with subprime and Alt-A together at 10%. Compared to 33% today for all of CRE, high yield and leveraged loans. Exposure represented as dollar volumes are far lower when looking through 2025, with $200bn each for high yield and leveraged loans. Adding CRE to the mix balloons these volumes but office, the main focus of most investors, adds only another $650bn relative to today’s nominal GDP of over $25tn. While the GFC showed how credit cracks can amplify and impact capital (and ultimately the real economy), the lower leverage today and the abundance of capital may prove to support the requisite workout solutions.
U.S. Nominal GDP, Outstanding Credit Sectors ($bn)(1)
Credit Sectors as % of Nominal GDP(1)