What's Going On with the Housing Market?
Affordability metrics and recent home price reports highlight the bearish trends in the residential housing markets - though the housing market is finding support from historically low levels of supply
The housing market remains tight, with affordability remaining low as mortgage rates have risen sharply on Fed tightening and home prices have eased only modestly following strong gains in prior quarters. Since 2Q’20, home prices have appreciated +45%, which has not been seen over such a short period since the 1980’s(1). We believe the key drivers for future home prices will be: (1) Fed rate actions, (2) employment market conditions, and (3) the affordability index, and industry research suggests we may ultimately see a peak-to-trough home price decline in the high teens on a percentage basis.
Recent Fed speak has the market believing “higher for longer” as market participants acknowledge that there is plenty more work to be done to tame inflation. Additionally, the November jobs report showed that payroll gains have slowed, and even though the unemployment rate rose, there remains excess labor demand relative to labor supply, with an elevated 1.8 job vacancies for every unemployed job seeker. More modest monthly gains in the October CPI were the result of declines in used car prices and a measurement technicality related to health insurance prices. Rapid price gains remained broad based in other areas and inflation rates are still elevated.
Vacancy rates for rental and owner-occupied homes are near 40-year lows, and supply is likely to remain constrained given slow housing completions relative to household formation. We expect the tight supply to prevent a complete retrace of the last three years of HPA, and instead for house prices to correct to early-tomid 2021 levels.
Vacant For Sale Units as a % of Total Housing Units(2)
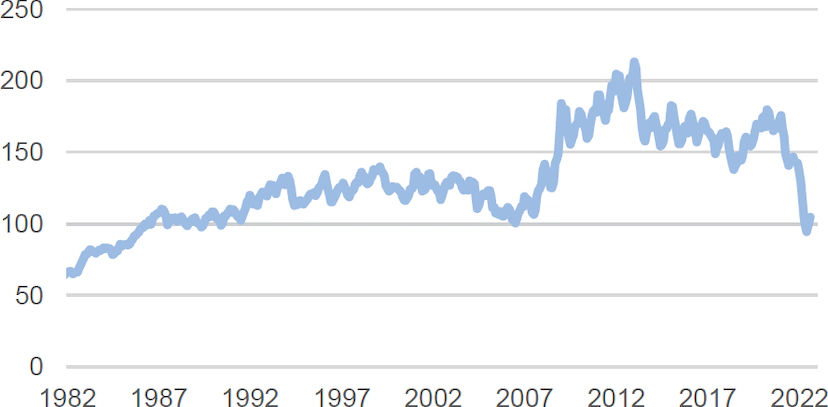
NAR Housing Affordability Index(3)
Relevant Market Metrics
|
Index |
December 31, 2021 |
November 15, 2022 |
|---|---|---|
|
2Y Treasury Yield |
0.73% |
4.43% |
|
10Y Treasury Yield |
1.51% |
3.77% |
|
Primary Mortgage Rate |
3.11% |
7.08% |
|
IG 5 Spread |
50 |
83 |
|
HY 5 Spread |
293 |
487 |
|
Yields by Asset Class(2) |
|
|
|
Single-Family Rental |
3.75 - 4.75% |
5.25% - 5.5% |
|
Business Purpose Loans |
6.5 - 8.0% |
9.0 - 9.5% |
|
Non-Qualified Mortgage |
4.0 - 4.5% |
8.0 - 8.5% |
Throughout 2022, there has been spread widening across most fixed income asset classes, with the expectation that spreads will remain wide as the market continues to be volatile
Macro Takeaways
- Rates: Expect Fed to continue to commit to tightening until inflation comes down. However, the pace of rate hikes may slow with the bulk of the policy adjustment now behind us. This means that the pressure on mortgage rates from Fed policy adjustments may begin to ease.
- Liquidity: Though there is a lot of liquidity in the market, capital remains sidelined as participants wait for stronger conviction.
- Volatility: No stability or clear trends in economic data, resulting in persistent volatility and opportunistic investment opportunities in the near-term. Volatility is likely to remain elevated amid a more certain economic and policy environment.
- Spreads: Continue to remain wide as uncertainty and volatility pervade and expect the yield curve to remain inverted in the near-term.
- Consumer: Strong consumer balance sheet as excess savings remain elevated. The labor market is also providing important support to the consumer as a continued excess demand for labor relative to the supply of labor - this indicates that nominal wage growth remains strong.
Change in home prices from May-Sept 2022(3)
Inversion of 2Y vs. 10Y treasury yields as of 11/15/22(1)
Excess household savings since March 2020(4)