The impact of the recent banking crisis on the real estate markets
The current stress in the U.S. regional banking system has resulted in significant levels of volatility in the markets and a reevaluation of the Fed’s path for interest rates
While the effects of recent events will play out over an extended period of time, some important developments have emerged over the last few weeks, giving us a preview of what’s to come.
Closely Monitoring the FDIC’s Potential Sale of Signature Bank & Silicon Valley Bank Assets:
How the FDIC approaches the sale of the assets from SBNY and SVB will have major implicationson the markets, particularly the residential and commercial mortgage space. With north of $60billion of loans being marketed and the potential for around $116 billion of securities to be sold, the sales could establish new pricing levels for assets(1).
Impact of the FDIC and Fed Stabilization Efforts:
In an effort to calm the flow of bank deposits, the FDIC and the Fed have put in place a number ofmeasures focused on stabilizing liquidity. The FDIC has guaranteed deposits at SBNY and SVBand the Fed implemented the Bank Term Funding Program (BTFP) to help assure banks have theability to meet their depositors’ needs. The funding provisions of the BTFP are very attractive, andas a result, $53.7 billion of funding was extended in the first two weeks of the program. Theseinitiatives should alleviate short-term funding pressure and ease concerns around the need for banks to sell assets to meet deposit outflows.
Continued Pressure on Credit Spreads in the Structured Products Market:
The above-mentioned regional banking issues paired with uncertainty around the Fed’s rate pathhave dampened hopes that CMBS activity will pick up substantially this year. Three banks priced a$1 billion conduit transaction at the end of March at some of the widest new-issue levels since theFinancial Crisis. As credit concerns build over the coming months and borrowers continue handing back keys, we and the markets expect spreads to remain volatile.
Fed Selling Mortgages Off the Table:
As recently as last fall, the market was focused on the impact of the Fed’s potential liquidation of itsmortgage portfolio holdings. Due to the illiquidity in the markets, this sentiment has shifted. Therecent comments made by Fed Chair Powell support the thesis that the Fed liquidating its mortgage holdings is currently off the table.
- Source: Reuters News, March 31st 2023.
Relevant Market Metrics
Market Spreads(1)
|
Index |
December 31, 2022 |
February 28, 2023 |
March 31, 2023 |
|---|---|---|---|
|
2Y Treasury Yield |
4.43% |
4.82% |
4.03% |
|
10Y Treasury Yield |
3.87% |
3.92% |
3.47% |
|
Primary Mortgage Rate |
6.41% |
6.66% |
6.24% |
|
IG 5 Spread |
82 |
76 |
76 |
|
HY 5 Spread |
484 |
463 |
463 |
March saw unprecedented volatility in the treasury market, with the 2yr yield touching 5.07% and rallying as much as 140bps before ending the month at 4.03%
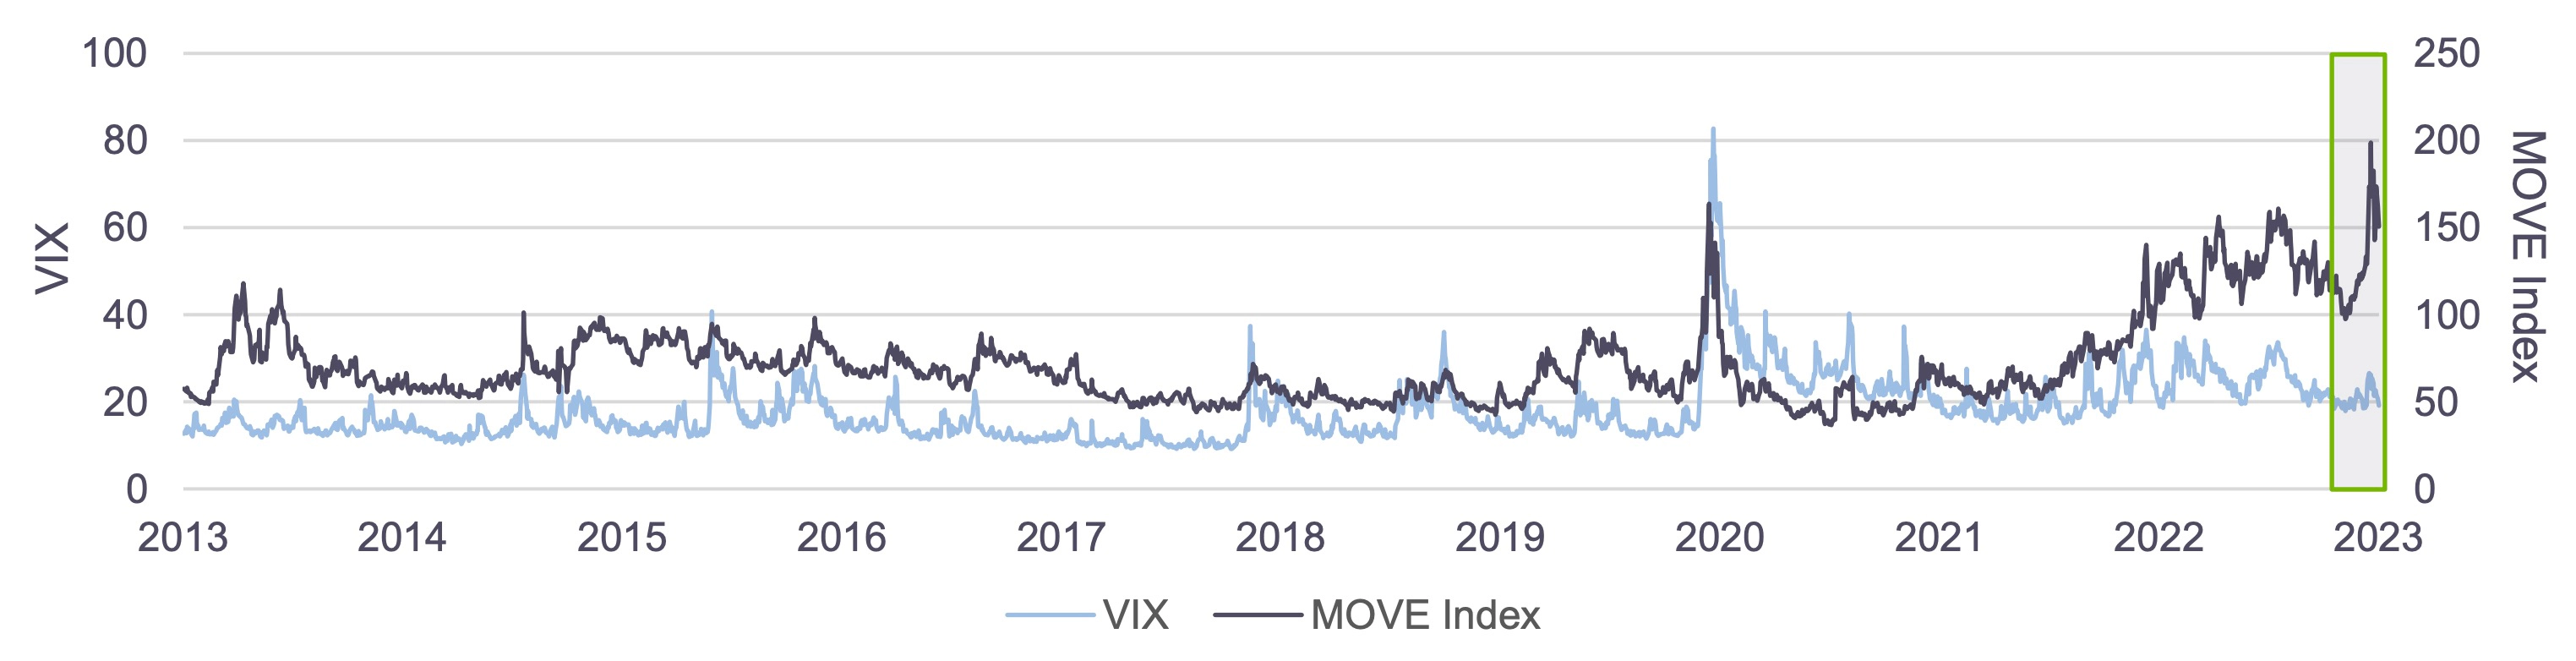
Treasury Volatility at Historic Highs(1)
Treasury volatility settling down is key to tightening mortgage spreads.
- The graph below maps the MOVE Index, which measures treasury volatility, against the VIX, a popular measure of equity market volatility
- Over the last decade, the index has moved in conjunction with the VIX, but lately we’ve seen massive treasury volatility amidst more muted stock market volatility
- For reference, in 2019 the MOVE Index averaged 63, the COVID peak was 164 on March 9, 2020, and it recently peaked on March 15, 2023 at ~199
- The indices dropping is a key indicator that sentiment is improving
Treasury Volatility vs. Equity Market Volatility(2)
Implied December 2023 fed funds rate from interest rate futures(1)
FOMC participants’ median projected December 2023 Fed Funds rate(3)
Inversion of 2Y vs. 10Y treasury yields as of 3/31/23(1)