The Growing Disconnect Between the Fed and the Markets
The market continues to battle the Fed’s monetary policy tightening narrative
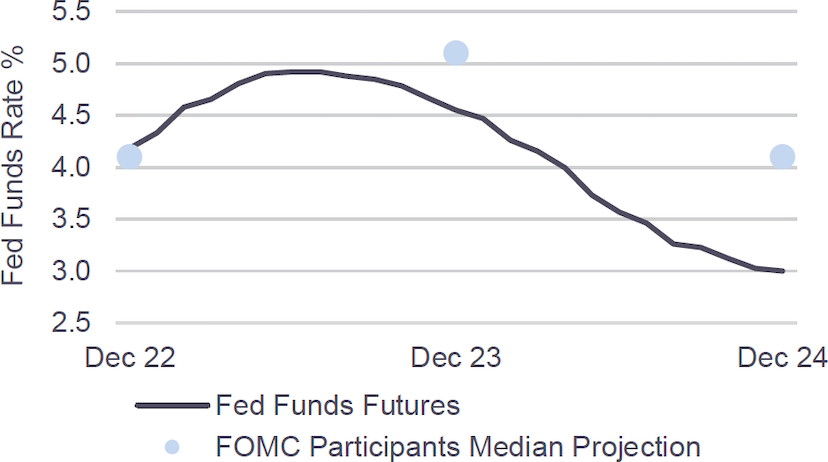
After sharply raising interest rates throughout 2022, the Fed has begun to signal a reduction in the size of its future hike(s). Following four consecutive 0.75% increases, the Fed raised its funds rate by 0.50% in December and is now expected to downshift further to a 0.25% hike on February 1st. The pending deceleration, coupled with slowing economic data, has led market participants to price an end to rate hikes by May of 2023 and potential rate cuts in Q4 2023. If the markets are right, this would put the terminal Fed funds rate for this cycle just below 5% and would hold it there for less than 6 months. In contrast, at the most recent Fed meeting in December, the terminal rate was estimated to be 5.1%. The Fed has also been quite vocal that a rate cut in 2023 is not on the table.
Economic data will be the major focus for all parties as we move further into 2023 and closer to the end of the Fed’s hiking cycle. Fed governors don’t seem convinced the data indicates inflation is subsiding yet, but market participants have taken comfort from seemingly benign recent CPI prints. The employment picture remains a key focus as well. Fed models link inflation to the tightness in the labor market and, although job creation slowed in 2022, the labor market was still tight with 1.8 job openings for every unemployed job seeker(1).
The Fed is acutely aware that stopping or easing too quickly would have a dramatic effect on the health of the economy. With this in mind, we would expect a measured response to positive data. Adding additional volatility to the market has been the stalemate in Washington over the debt ceiling.
The US Government is again nearing its debt ceiling limit with only ~$70bn in remaining borrowing capacity. The treasury estimates that it will be able to continue borrowing until the middle of 2023. Look for this to inject more unwanted volatility into the markets if/when the issue drags on.
Fed Funds Paths: Markets vs. the Fed(2)
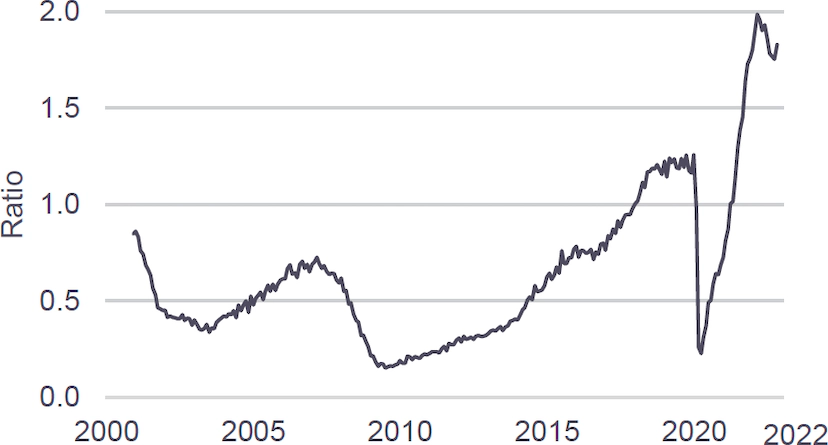
Job Openings per Unemployed Job Seeker(1)
Relevant Market Metrics
Market Spreads(1)
|
Index |
December 31, 2021 |
December 31, 2022 |
January 24, 2023 |
|---|---|---|---|
|
2Y Treasury Yield |
0.73% |
4.43% |
4.21% |
|
10Y Treasury Yield |
1.51% |
3.87% |
3.48% |
|
Primary Mortgage Rate |
3.11% |
6.41% |
5.66% |
|
IG 5 Spread |
50 |
82 |
72 |
|
HY 5 Spread |
293 |
484 |
437 |
|
Yields by Asset Class(2) |
|
|
|
|
Single-Family Rental |
3.75 - 4.75% |
5.25% - 5.5% |
5.25% - 5.5% |
|
Business Purpose Loans |
6.5 - 8.0% |
9.0 - 9.5% |
9.5 - 10.0% |
|
Non-Qualified Mortgage |
4.0 - 4.5% |
8.0 - 8.5% |
7.5 - 8.0% |
Since the start of the new year, the 2s10s curve has become more inverted as 10-year real yields declined sharply. Mortgage and corporate spreads have narrowed in early 2023 with notable tightening in high yield corporates.
Looking Ahead
The economic landscape remains top of mind following a year highlighted by historically high inflation and significant Fed intervention.
- Significant spread widening and liquidity constraints in 2022 curtailed capital markets activity across all sectors. While activity levels have improved to start 2023, significant progress must be made to bring strength back to the markets.
- Driven by an active Fed and limited institutional balance sheets, interest rate markets saw heightened volatility in the 2nd half of 2022. The average daily change in US 10yr Treasury yields was 2x that of the average of the prior five years. Look for any clarity around the Fed’s timing and ultimate path to help volatility get back to normalized levels.
- The consumer continues to be supported by a robust labor market and a strong balance sheet. The December jobs report cited the lowest unemployment rate in approximately 54 years. Major US Banks continue to report customers holding excess savings accumulated during the pandemic.
Implied December 2023 Fed Funds rate from interest rate futures(3)
FOMC participants’ median projected December 2023 Fed Funds rate(3)
Inversion of 2Y vs. 10Y treasury yields as of 1/24/23(1)