Q1 Check-In On NDFI Lending
The Rithm Take
In February we laid out the structural case for Non Bank Financial Institutions (NBFI) lending as the balance-sheet expression of private credit, including asset-based finance, becoming embedded in the banking system. The Q1 2026 data, drawn from both the Fed's H.8 release and granular call-report filings, confirms that thesis has not just continued, but deepened.
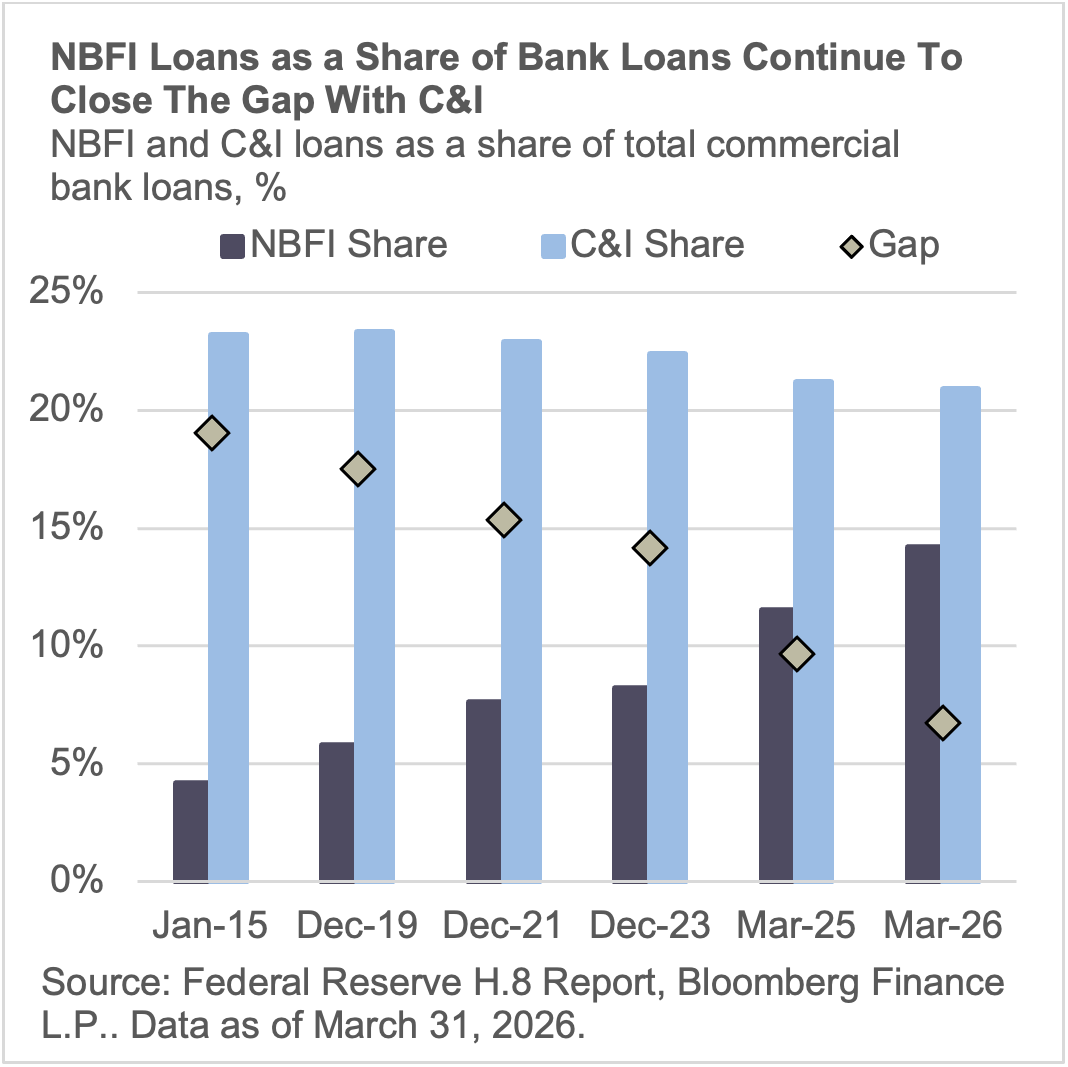
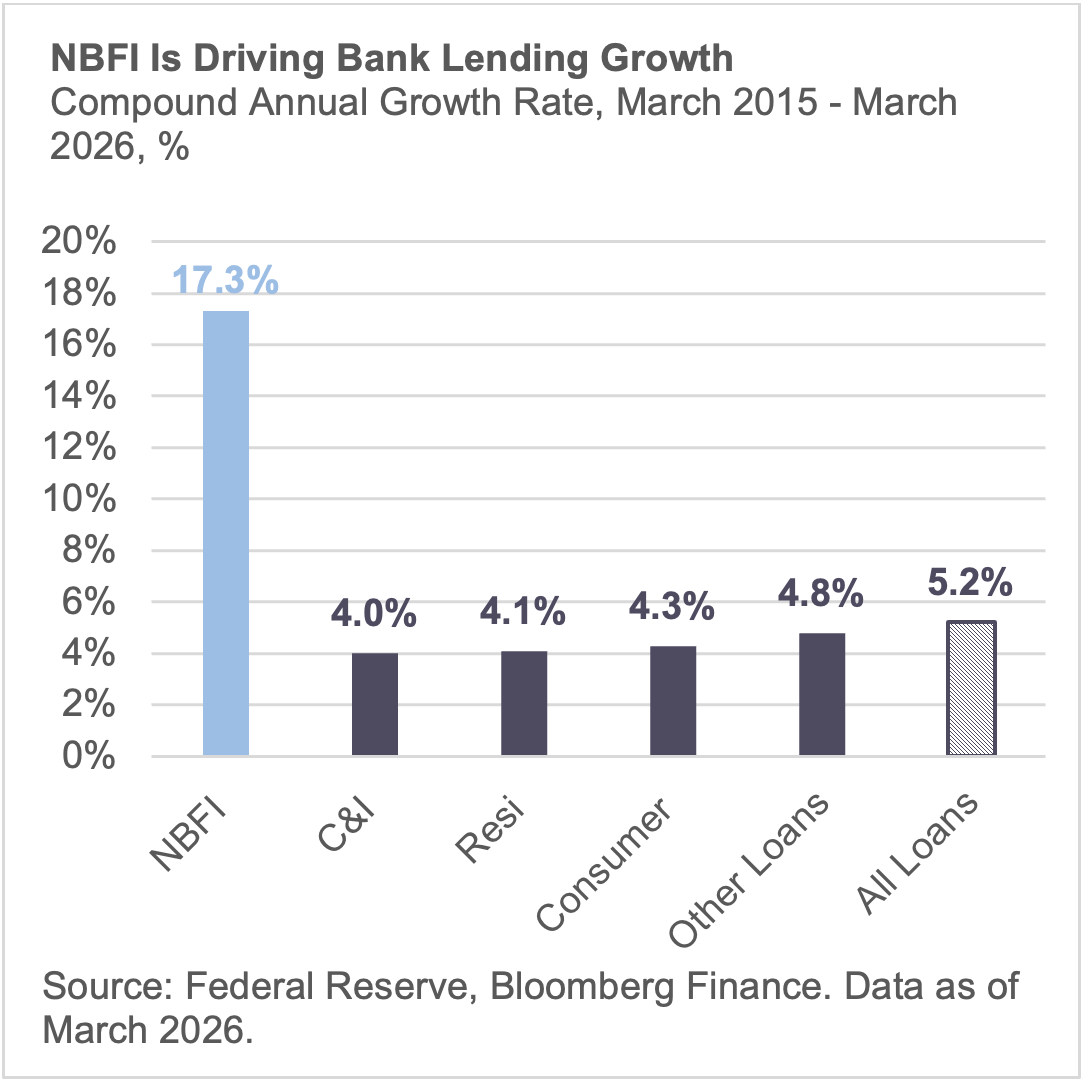
Total bank lending to nondepository financial institutions reached $1.93 trillion in March, up $75 billion from December and $470 billion from a year earlier. NBFI's share of all commercial bank loans now stands at 14.2%, up from 13.8% at year-end and 11.5% twelve months ago. For reference, that share was roughly 4% a decade ago. The compound annual growth rate on NBFI lending over that span is north of 17%, more than triple the roughly 5% rate for total bank loans.
NBFI lending has now increased for five consecutive quarters, averaging roughly $117 billion per quarter since Q1 2025.This looks to be the new run rate.
Bottom line: NBFI lending is at scale, compounding at a rate that is reshaping the composition of bank loan books in real time.
The warehouse pipeline is where the acceleration lives.
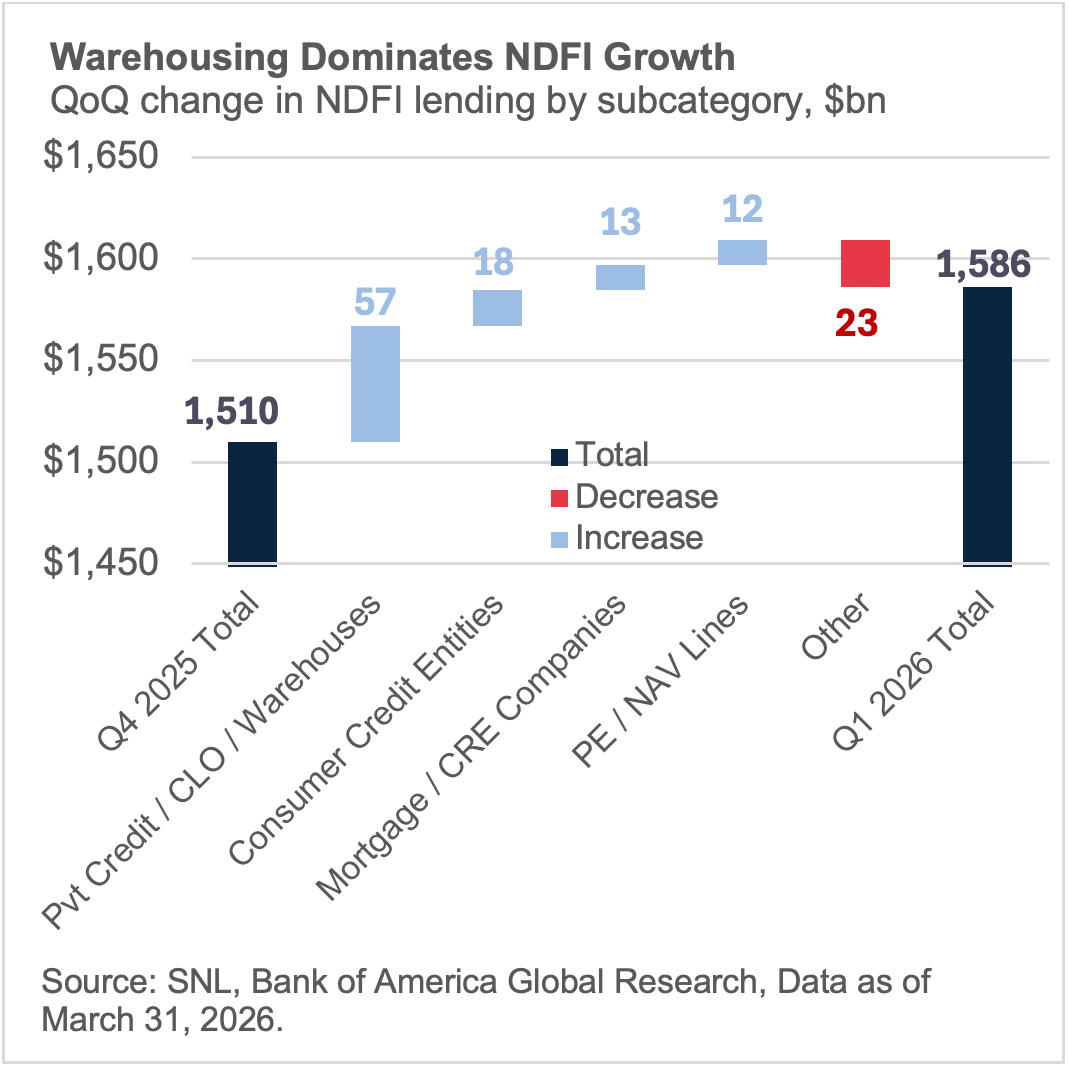
Call-report data across roughly 120 reporting banks lets us look inside the NBFI category, and the picture is not one of broad, evenly distributed expansion. Three-quarters of the quarter's incremental growth came from a single sub-category: private credit, CLO, and warehouse facilities. That channel added $57 billion in Q1 alone, growing 15% quarter-over-quarter and pushing its share of the tracked NBFI total from 24% to 27%.
This is the ABF throughput mechanism in the data. Warehouse lines are what connects bank balance sheets to the origination pipeline. When this sub-category accelerates at multiples of every other NBFI channel, it confirms that banks are not simply growing a diversified financial-institutions book. The marginal dollar is flowing into the infrastructure that ABF requires to function: the capacity to originate, aggregate, and stage assets before terming them out through securitization or private placement.
PE/NAV lines and mortgage company lending, by contrast, grew at low-single-digit rates quarter-over-quarter. Both remain large in absolute terms, but neither is driving the incremental story.
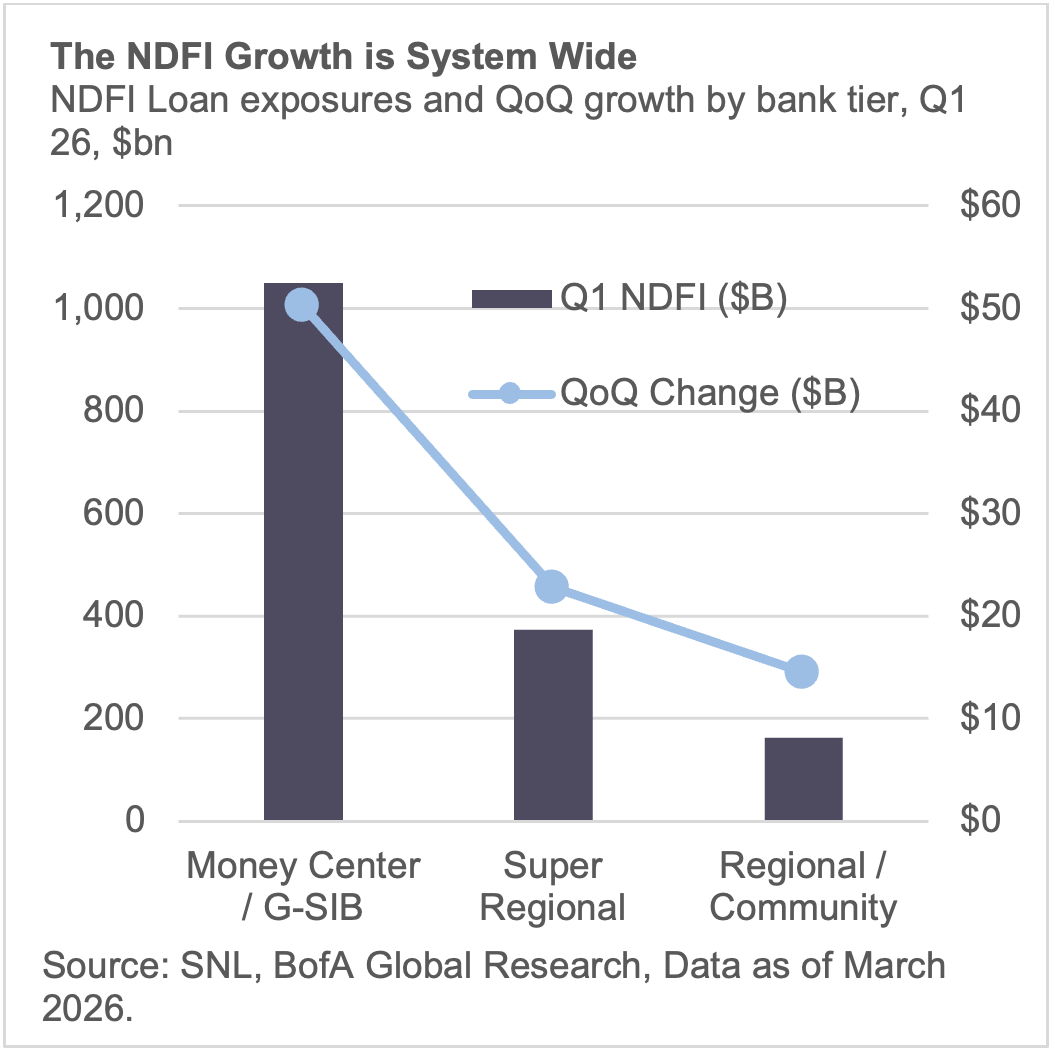
The breadth across bank tiers tells the institutionalization story.
Money center and G-SIB banks hold roughly $1.05 trillion in NDFI exposures and contributed $50 billion of Q1 growth, led by Wells Fargo and Bank of America. At the G-SIB level, NBFI/ABF lending is now embedded infrastructure: JPMorgan, Goldman, and Citi each carry $120 billion or more, with warehouse and PE/NAV lines distributed across the full product set.
Super regionals collectively hold $374 billion and added $23 billion in Q1. These banks are building dedicated ABF-adjacent platforms with scale and sub-category specialization that mirrors the money centers a few years ago.
Regional and community banks account for a smaller slice at $163 billion, but they contributed $15 billion in Q1 growth, a 16% share of incremental system expansion that is disproportionate to their 10% base. Names like Western Alliance, Texas Capital, Pinnacle, and East West are carving out niches in mortgage warehouse, specialty PC, and PE/NAV lending. When the product scales down to regionals with $5-15 billion NDFI books, it has been standardized, risk-managed, and operationally embedded.
NBFI is converging on C&I as a share of bank loan books.
A year ago, NBFI lending represented 11.5% of total bank loans versus 21.2% for C&I. Today the gap has compressed from 9.6 percentage points to 6.7. The comparison is less a prediction about crossover timing and more a statement about category weight. NBFI has moved from a reporting footnote to a category that rivals the traditional backbone of corporate bank lending in both scale and growth trajectory.