PIK Beyond the Headlines: Mechanics, Not Meltdown
The Rithm Take
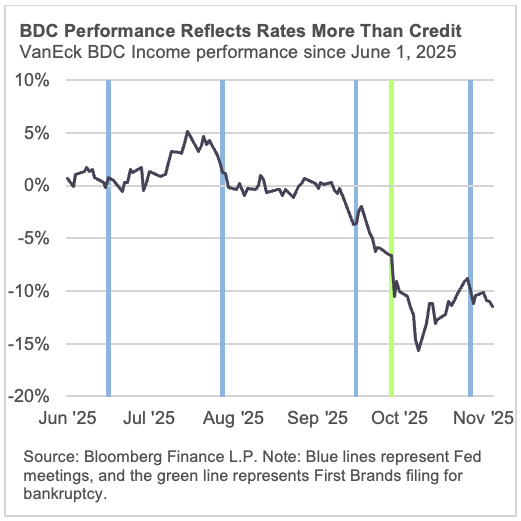
What just happened in listed, exchange-traded BDCs is a repricing, not a crack. The initial move downward was driven by heightened concerns about dividend cuts in the near to medium term as short-term rates move lower and credit spreads tighten, especially at the upper end of the middle market.
The next leg down stemmed from a cluster of high-profile bankruptcies, largely due to fraud, and the ensuing attention-grabbing headlines about “cockroaches” and a long-awaited private-credit bubble.
We believe these events are largely noise, not a signal. First, while tighter spreads are negative for listed BDC dividends, they are positive for borrowers, as they reduce interest burdens. That increases interest coverage, which should support credit performance even as equity multiples compress.
Second, the recent wave of defaults was more relevant to the broadly syndicated market than to private credit.
Bigger picture: signs of stress in private credit have largely plateaued. This can change, but current data suggest otherwise.
The Conversation
A cluster of high-profile bankruptcies grabbed headlines, and the private-credit proxy, exchange-listed business development companies (BDCs), sold off. BDCs lend to middle-market, often sponsor-backed borrowers, so they are one window into direct lending. Importantly, they are no longer the only window, as data providers and transparency are increasing. In addition, exchange-listed BDCs can trade at a premium or discount to net asset value (NAV). Non-traded or private BDCs that are heavily sold into the wealth channel are not exchange-traded and therefore are not susceptible to this additional volatility. In addition, the credit profile of exchange-listed BDCs is not always the same as that of non-traded BDCs from the same manager.
Our read is that the spread reaction to the bankruptcies is more noise than signal. Instead, the drawdown has more to do with rate math than with a credit break. As front-end rates stepped down, floating coupons and distributable earnings reset lower, investors paid less per dollar of net operating income (NOI), and spreads widened (then partially retraced) without a broad change in asset quality.
The high-profile cases mattered for sentiment, but look-through exposures suggest the reaction was outsized. Across 166 BDCs, iCapital found little to no Tricolor exposure; only about 15 vehicles held a combined $237 million of First Brands debt (about 0.05% of roughly $503 billion in BDC AUM) versus about $1.7 billion in the broadly syndicated loan market, suggesting a headline-led repricing rather than a balance-sheet event for BDCs.
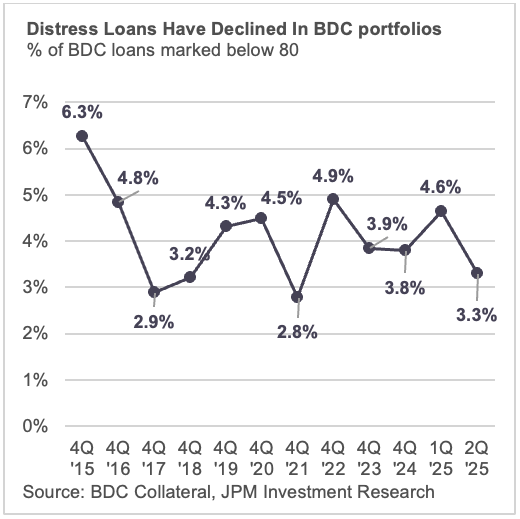
Distressed pricing has also declined in BDC portfolios. The share of loans priced below 80 in BDC portfolios stands at just 3.3%.
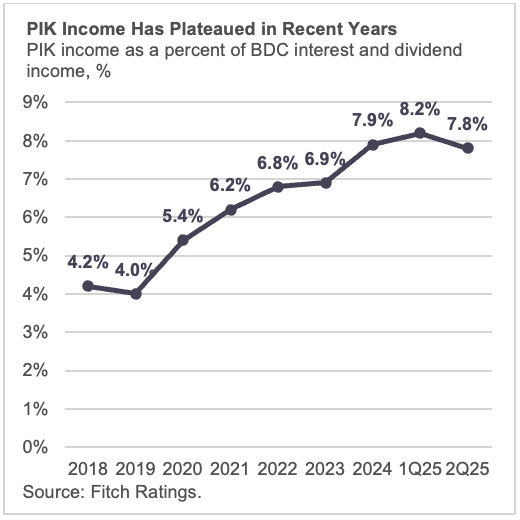
PIK has been a focal point in the debate. Payment-in-kind means a borrower accrues interest instead of paying cash, which can raise questions about earnings quality and leverage if it signals stress. Recent readings are moving in the right direction. PIK has come down. Per Fitch Ratings, the share of income from PIK eased from 8.2% in 4Q24 to 7.8% in 2Q25.
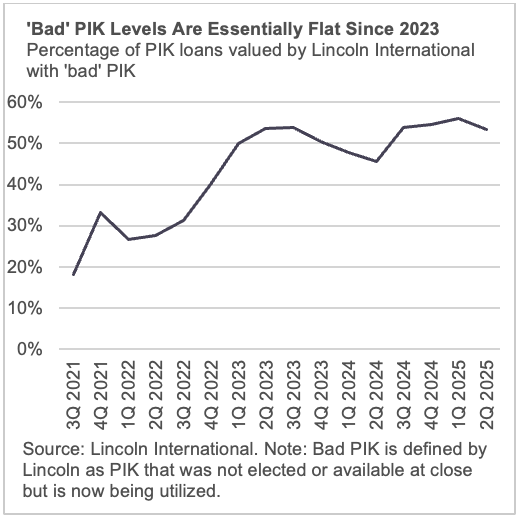
PIK is not always a negative. It is often part of the original deal to preserve cash during a growth phase or integration, and it can make sense when coverage is adequate and covenants are strong. When PIK is a problem, it is usually “bad PIK” that was not present at close and shows up later as a sign of strain. On that score, Lincoln International’s measure of bad PIK was 57.2% of PIK usage in 2Q25. It declined last quarter and sits below levels seen in 2023.
In August, private-wealth alt products took in $8.9bn of net inflows—the third-highest monthly print in the series—with credit at 55% and redemptions easing1. That keeps origination active. The concern about “money needing to be put to work” is most acute in the upper-middle-market, where about 50% of loans were held across the top six non-traded perpetual BDCs2. These BDCs are all focused on the upper-end of the middle market. These BDCs are focused on the upper end of the middle market. Elsewhere in the core middle-market and the lower-middle-market, that overlapping dynamic is less prevalent.
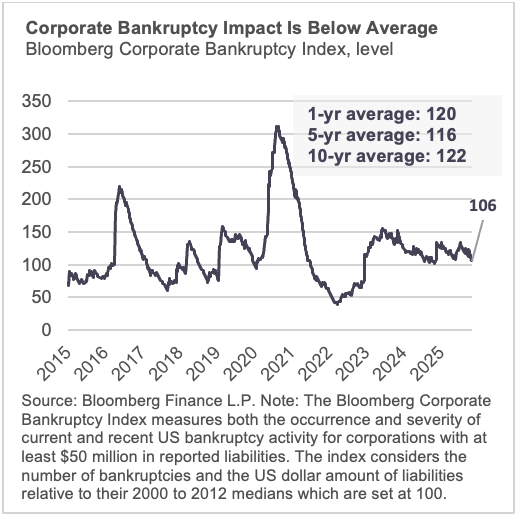
At the same time, easier Fed policy should reset benchmarks lower, and many portfolio companies can see interest burdens come down, which supports coverage and repayment capacity. For now, bankruptcies do not appear elevated, as evidenced by Bloomberg’s corporate-bankruptcy index for companies with at least $50 million in liabilities, which remains below its 1-, 5-, and 10-year averages.
System context remains supportive. IMF work shows that banks’ loans and commitments to nonbank financial intermediaries have grown over the last decade, bringing private-credit linkages further inside the supervisory and policy perimeter.
Stepping back, this episode looks like a rate-and-optics repricing, not a credit break in direct lending. Listed BDC stock movement is not always an indication of concerns in direct lending. The default headlines overstated direct exposure. Quantifiable signs of stress such as PIK and asset markdowns have plateaued and, in some cases, decreased. Fundamentally, lower policy rates ease borrower interest costs and can lead to increased economic activity, both of which are positive for direct lending. Net result: fundamentals are intact, with a few pockets to monitor for dispersion rather than broad deterioration.