Liquidity Fatigue and Labor Scarcity: The Next Market Stress Points
The Rithm Take
Markets have grown increasingly comfortable with the soft-landing narrative. Growth remains resilient, credit spreads are tight, and risk assets continue to climb on expectations of lower rates. For now, we see the expansion extending into 2026.
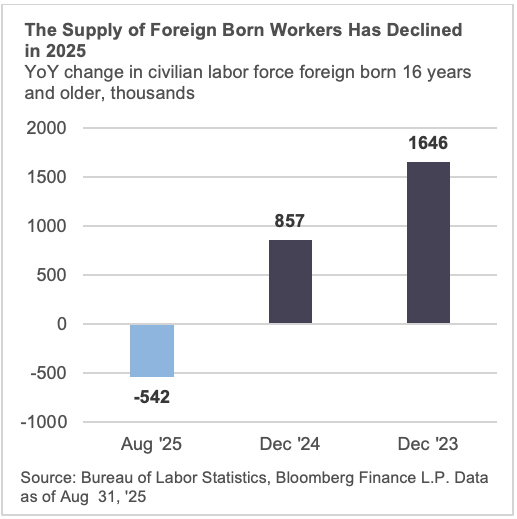
But beneath that surface strength, imbalances are quietly building. Labor supply is tightening for structural reasons, with foreign-born employment falling by roughly half a million this year and aging participation plateauing. Liquidity cushions across the financial system are thinning as quantitative tightening (QT) continues, and reserve ratios are again approaching levels that preceded the 2019 funding stress. Meanwhile, consumer resilience is narrowing — the top 10% now drive nearly half of all spending — making growth increasingly dependent on asset prices.
These dynamics don’t yet threaten the cycle — but they limit its durability. A smaller labor pool, aging workforce, liquidity fatigue, and consumption concentration create fault lines that could amplify volatility if conditions shift. Inflation could reaccelerate if labor scarcity collides with easing policy, while a liquidity or asset-price shock could ripple more broadly through an economy which is growing more top-heavy.
In short, the U.S. expansion remains intact, but these are the dynamics we’re watching as the line between froth and fragility blurs.
Market Signals
1. Labor Supply Constraint
The labor market remains tight — not because of runaway demand, but because supply is shrinking. Foreign-born employment has declined by roughly 500,000 workers this year amid changing immigration policy, reversing a multi-year trend of inflows. At the same time, the native-born workforce is aging, and participation rates have plateaued. Barclays projects monthly job growth slowing to ~10k by 2027, compared with 150k earlier this year.
This structural slowdown in labor supply limits the economy’s potential growth rate. Sectors that rely heavily on foreign labor — construction, agriculture, hospitality — are already reporting rising wage pressures and project delays. As the Fed eases policy into 2026, the mismatch between demand and available labor could reawaken inflationary pressures even without new stimulus. The headline data still show resilience, but the margin for slack is narrowing.
What we’re watching: Department of Homeland Security immigration statistics, ICE deportations and removals data, temporary worker visa issuances, labor demand and wage inflation within high immigrant workforces.
2. The Aging Drag
Demographics are becoming an underappreciated constraint on U.S. growth. The median age has reached 38.1, the oldest on record, while the 65+ population now accounts for nearly 20% of Americans. Older workers are participating more — with labor force participation near 20% for this cohort, up from 12% in 2000 — but the overall aging trend caps productivity and labor force expansion.
Empirical studies from the NBER show that every 10% increase in the share of older adults can trim long-run per-capita GDP by roughly 5.5%. In a $30T+ economy, even a modest deceleration translates into a meaningful drag on output growth. Aging also shifts spending patterns — toward health care and services, away from goods and housing — and reduces the productivity of an economy. These subtle shifts make the economy more rigid and less responsive to policy support, leaving it vulnerable to negative shocks.
What we’re watching: Job gains in the healthcare segment of the economy (healthcare has added 514k non-farm payrolls to the total 598k payrolls in 2025), labor force participation trends by age cohorts, housing turnover and migration trends.
3. AI Disruption and Youth Unemployment
While labor scarcity dominates the headlines, a quiet dislocation is emerging underneath. Youth unemployment (age 16-24) has risen to 10.8%, more than double the national average, as automation begins to displace early-career jobs. If just 5% of current youth employment is automated out of existence youth joblessness could rise toward 15% (assuming no job replacement).
The risk is less about headline unemployment and more about composition. Entry-level disruptions create a “missing rung” on the labor ladder, slowing skill formation and household formation over time. It also bifurcates income growth — high for mid-career talent, weak for new entrants — embedding inequality into the next expansion cycle. These dynamics could dampen consumption, mobility, and eventually productivity growth, even as aggregate employment appears strong.
What we’re watching: Corporate AI adoption surveys, youth share of unemployment, average weekly earnings by age group (16-24), job openings in entry-level categories, and corporate earnings commentary specifically mentions of “AI efficiency” and “automation”.
4. Second-Round Inflation Risk
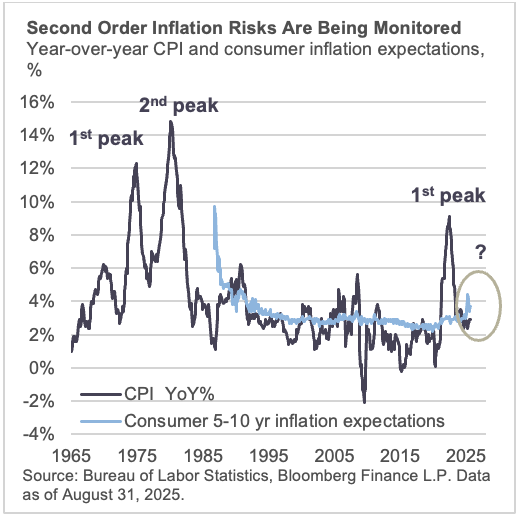
Headline inflation has cooled, but the risk of a second wave remains alive beneath the data. Wage growth has moderated to 3.8% YoY, close to pre-pandemic norms, yet the structural forces point in the opposite direction: a smaller labor pool, elevated union activity, and still-firm inflation expectations. Surveys show 5-year consumer inflation expectations remain above 3%, a level inconsistent with the Fed’s 2% target.
If average hourly earnings reaccelerate toward 5%, core services inflation could stay anchored around 3.5–4%, forcing policymakers to reconsider the current easing bias. The parallels to the 1970s are clear — an initial inflation shock, a period of moderation, and then a delayed wage catch-up once labor scarcity collides with elevated price expectations. For now, inflation is trending lower, but a “second act” remains plausible if the supply side doesn’t improve.
What we’re watching: Market participant inflation expectations (10-year breakevens and inflation swaps), consumer inflation expectations (UMich 5-10 years inflation expectations), wage union commentary/settlements/strike activity, corporate margins, and New York Fed reservation wage surveys.
5. Liquidity in Funding Markets
The Fed’s quantitative tightening campaign has meaningfully reduced systemic liquidity. The balance sheet has contracted to $6.5T from a $9T peak, while Reverse Repo balances have effectively fallen to zero. Bank reserves as a share of liabilities are trending lower, and the Secured Overnight Financing Rate (SOFR) is trading at the top of the Fed’s target range.
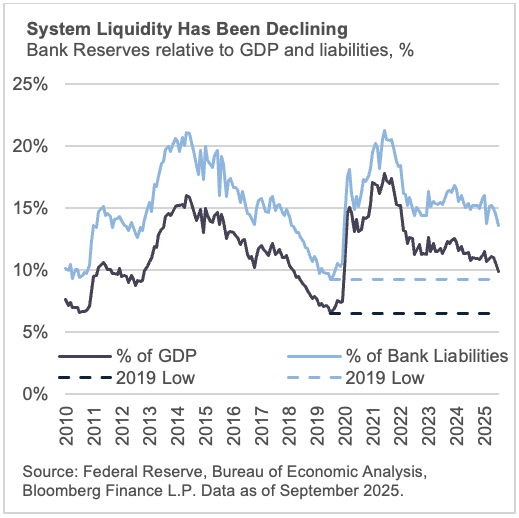
Funding conditions are not yet stressed, but the pattern is familiar. The last episode of repo dislocation in 2019 occurred when reserve ratios fell to 8–10% of GDP — levels the system is again approaching. With money market demand still high and reserve buffers eroding, the next source of market volatility may emerge from the plumbing, as liquidity risk is returning to the surface, not the credit channel.
What we’re watching: SOFR, Overnight Reverse Repo Facility (ON RRP) usage and concentration, bank reserves, and Fed commentary on QT.
6. Consumer Bifurcation
Headline consumer data continues to look healthy. Household debt-to-GDP sits near 68%, the lowest in two decades, and total household debt stands at $18.4T. But the composition tells a different story: the top 10% of households now account for ~49% of total spending, while the bottom 50% hold only 2–3% of aggregate net worth.
This concentration means the macro-outlook depends disproportionately on the spending behavior of affluent households. A 10–20% correction in asset prices could meaningfully curtail consumption, even if employment remains stable. At the same time, lower-income households are showing strain — credit-card delinquencies have risen to 3%, student loan delinquencies exceed 10%, and pandemic-era savings buffers are gone. Aggregate resilience masks rising fragility at the bottom.
What we’re watching: Card spending by cohort, credit availability across cohorts, delinquency rates across cohorts and debt service ratios by cohorts.
Bottom Line:
The expansion remains intact, but its foundation is narrowing. Labor scarcity, demographic drag, liquidity fatigue, and consumer concentration all suggest the economy is entering a more constrained phase of the cycle. Growth can continue, but the margin for policy or market error is shrinking. These are the pressure points we’re watching as froth builds, and the late-cycle dynamics take shape.