How History Has Rhymed…on Yields and Inflation
A Return to Normal?
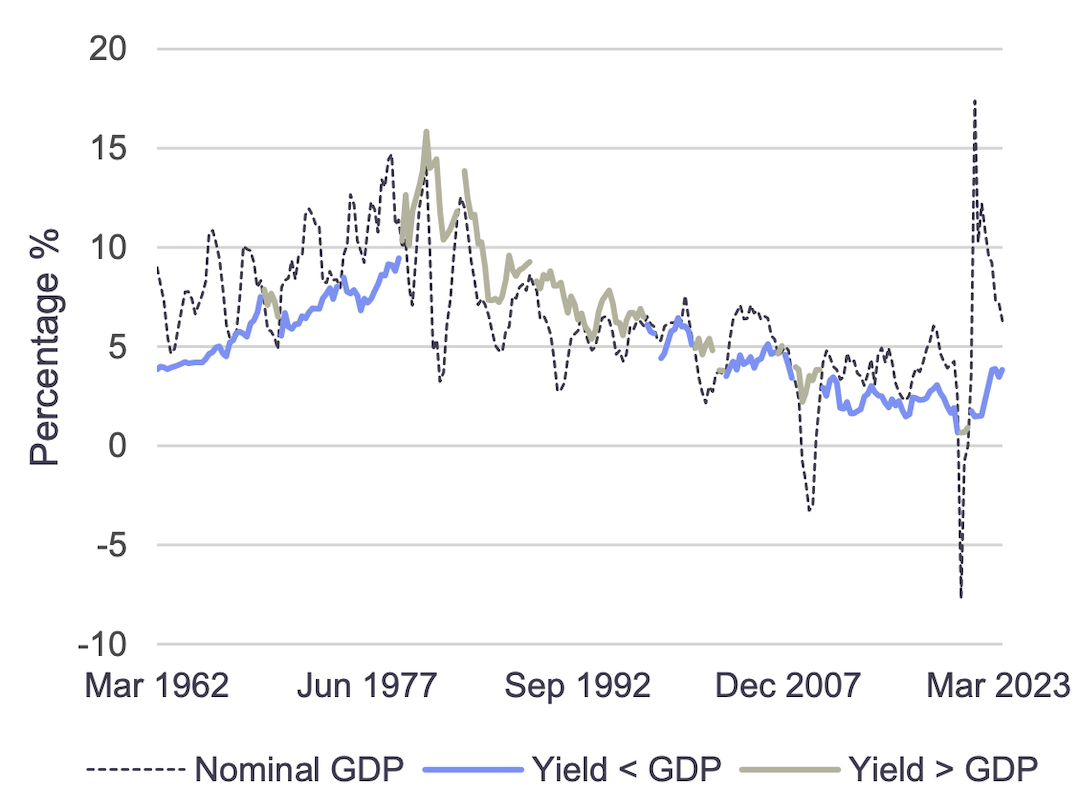
Are today’s higher Treasury yields signaling an end to the post-Global Financial Crisis (“GFC”) era of financial repression? If so, what could a return to normal look like? History shows the 10-Year Treasury yield trending to the annual nominal GDP growth rate (“GDP”), however, with long periods of under- and over-shooting.
GDP YoY Growth Rate, 10-Year Treasury Yield((1)
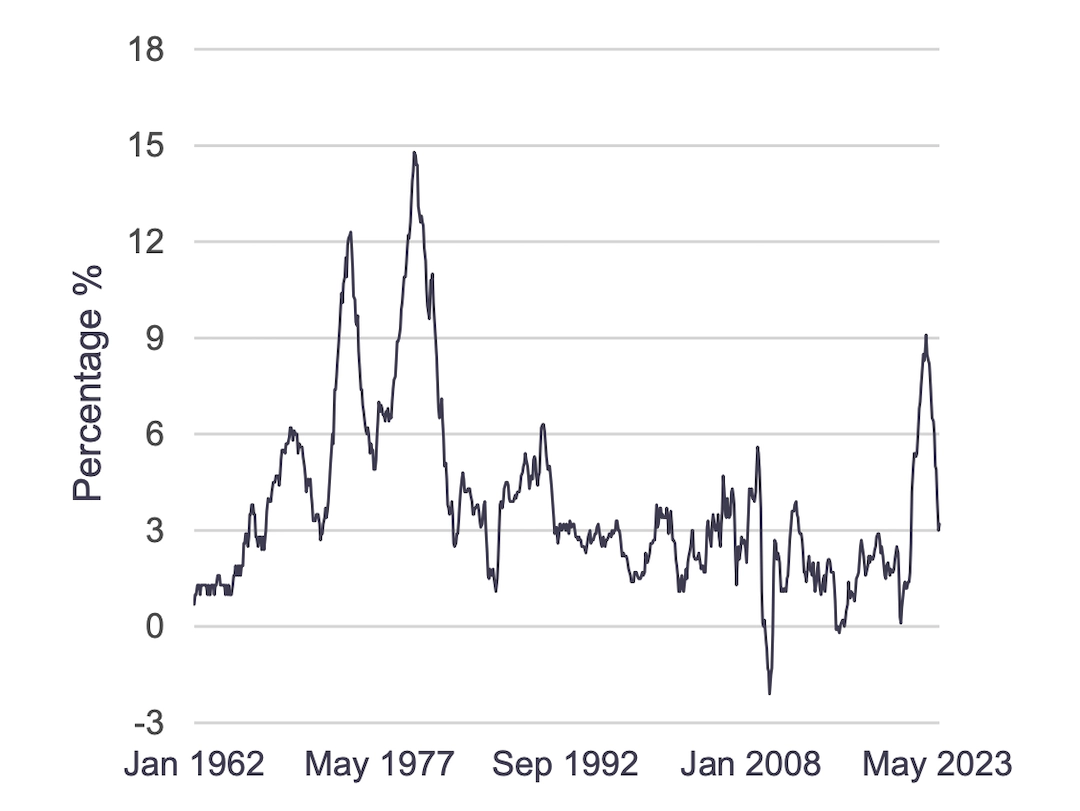
CPI YoY Timeline Since 1962(1)
A 60-Year Lookback
Inflation risk premium has been a driving factor in the long periods of yield over- or under-shoots relative to GDP. The period of price stability in the 1960s saw yields well below GDP. In contrast, yields were well above nominal GDP growth in the 1980s as the period of high inflation in the 1970s-80s resulted in investors demanding higher compensation for inflation risks. The 1990s saw yields relatively closely tracking GDP on price stability with inflation close to the Federal Reserve’s (“the Fed”) 2% target. China’s entry into the World Trade Organization in December 2001 began to mark a period of the 10-Year Treasury yielding below GDP. Its burgeoning exports led to growth in US dollar reserves, which got recycled back into US debt. Yields below the GDP growth path only continued post-GFC as the Fed launched several Quantitative Easing programs, buying US Treasuries and agency mortgage-backed securities.
Where are We Today?
Yields today are closing the gap to GDP, flagging an end to the era of financial repression. Either the GDP growth rate slows, or 10-Year yields have room to rise- time will tell. Inflation today is paralleling the trajectory from the early-to-mid 1970s. The economy is materially different today, less dependent on oil, however facing structural shortfalls in labor and housing. The fiscal deficit, as a share of nominal GDP, is higher today, at 8.4%, compared to no more than 5% in the 1990s and before.
The Rithm Take
The Fed signaling continuing Quantitative Tightening through a period of future monetary policy easing is signaling an end to the post-GFC period of financial repression. Over the last 60 years, nominal GDP growth has averaged 6.3% and the 10-year Treasury yield has averaged 5.9%, a 40bps difference. Trend nominal GDP growth is expected at 4.5-5%. A return to normal could see yields trending more closely to GDP, such as was the case in the 1990s. This is contingent on inflation cooling towards the Fed’s target.