“Higher for Longer” – The Markets Come Back to the Fed
The market has quickly come to terms with a longer, more restrictive policy environment
The disconnect between the Fed and the markets has dissipated following January economic data and recently released Fed minutes.
|
Date |
Event |
Actual |
Survey |
|---|---|---|---|
|
Feb 3, 2023 |
Change in Nonfarm Payrolls |
517k |
189k |
|
Feb 3, 2023 |
Change in Private Payrolls |
443k |
190k |
|
Feb 3, 2023 |
Unemployment Rate |
3.4% |
3.6% |
|
Feb 14, 2023 |
CPI Year-Over-Year |
6.4% |
6.2% |
|
Feb 24, 2023 |
New Home Sales MoM |
7.2% |
0.7% |
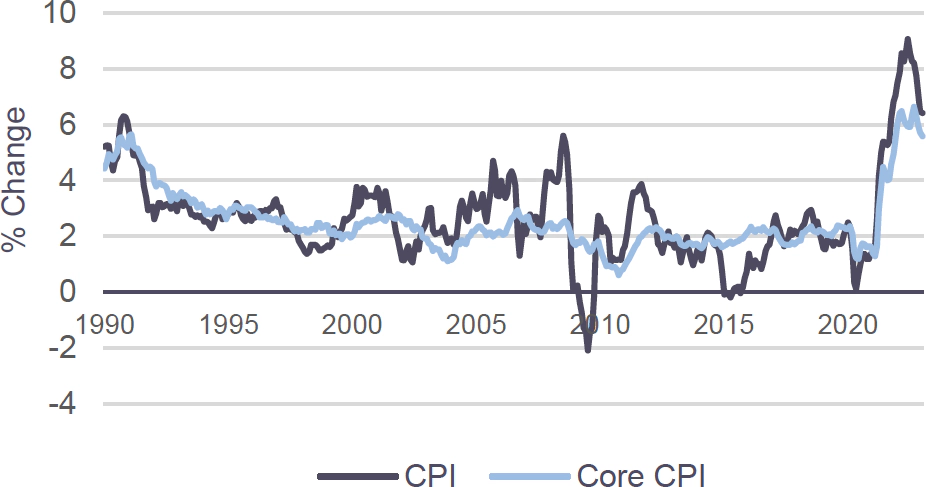
The Fed’s recent comments citing the need for ongoing rate hikes paired with recent data reinforces the notion that we have yet to see signs of a disinflationary environment. With nonfarm payrolls up over 500k, the lowest unemployment reading since October 1953, CPI above expectations, and 1.9 job vacancies per unemployed person, there is little in the data that signals the labor market is cooling.
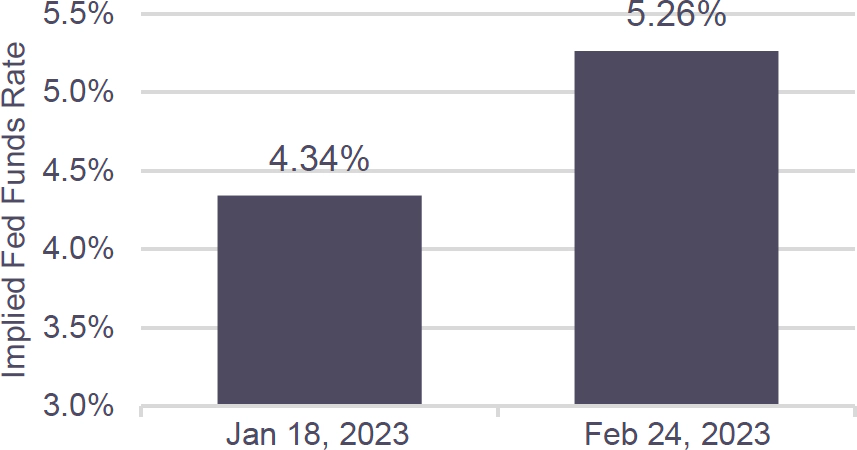
After months of divergence over the perceived path of monetary policy, the Fed and the markets are now aligned. Futures markets have only 12bps of rate cuts priced in by the end of 2023 vs. 48bps of cuts at the time of last month’s market update. The market is expecting a peak fed funds rate of ~5.4%, reflective of three more 25bp hikes. We expect the conversation to now be centered around how long the peak rate is maintained. While there is little reason to believe the Fed will stray from 25bp hikes, markets are assigning a ~16% probability for a 50bp hike in March.(2)
- Source: Bloomberg. Includes revised figures for Change in Nonfarm Payrolls and Change in Private Payrolls.
- Source: Bloomberg & RDQ Economics. As of 2/24/2023.
Year-Over-Year % Change in CPI(2)
Year-End 2023 Fed Funds Market Pricing(2)
Market Spreads(1)
|
Index |
December 31, 2022 |
January 24, 2023 |
February 24, 2023 |
|---|---|---|---|
|
2Y Treasury Yield |
4.43% |
4.21% |
4.81% |
|
10Y Treasury Yield |
3.87% |
3.48% |
3.94% |
|
Primary Mortgage Rate |
6.41% |
5.66% |
6.66% |
|
IG 5 Spread |
82 |
72 |
76 |
|
HY 5 Spread |
484 |
437 |
465 |
|
Yields by Asset Class(2) |
|
|
|
|
Single-Family Rental |
5.25% - 5.5% |
5.25% - 5.5% |
5.50 - 5.75% |
|
Business Purpose Loans |
9.0 - 9.5% |
9.5 - 10.0% |
10.0 - 10.5% |
|
Non-Qualified Mortgage |
8.0 - 8.5% |
7.5 - 8.0% |
8.0 - 8.5% |
2Y and 10Y treasuries sold off in February as the markets responded to Fed speak and new economic data.
Recent Surveys Highlight “Cautious Optimism” in Housing
- Surveys of homebuilders and consumers point to some improvement in home buying conditions. The National Association of Home Builders Diffusion Index of Expected Home Sales, which gauges market expectations for sales over the next six months, rose from 31% in November 2022 to 48% in February 2023. Additionally, the University of Michigan’s Consumer Sentiment Survey reported that buying conditions for houses improved from a low of 33 in November to 51 in February. ‒ Though the results are positive and highlight some improvement, these indexes stood at 80% and 73, respectively, only one year ago.
- Home buying is still well behind stable historical levels, but the slight decline in mortgage rates since November 2022 highs appears to have pulled some buyers back into the market. Cautious optimism amongst builders and consumers exists, creating some confidence around the housing market. Median home resale prices in January were up – albeit only 0.7% year-over-year – and sales and construction activity may be close to bottoming out.
Implied December 2023 Fed Funds rate from interest rate futures(3)
FOMC participants’ median projected December 2023 Fed Funds rate(3)
Inversion of 2Y vs. 10Y treasury yields as of 2/24/23(1)