Eyes On The Market Q4 2025
The Rithm Take
Q4 opens with a stable macro surface and three identifiable event risks that could tilt the path. The labor market looks firm in aggregate, yet entry-level hiring has thinned; if that persists, younger cohort pressure may shape 2026 policy sentiment into the midterms. The upcoming Fed Chair appointment will refocus markets on the rate path and destination; even modest shifts in tolerance for inflation risk, balance sheet strategy, or reaction-function language can move the front end and the term premium. And trade remains a live variable: the Supreme Court’s ruling on emergency tariff authority will determine whether today’s regime persists, migrates to alternative statutes, or partially unwinds—keeping planning for import margins and Treasury cash flows in a holding pattern until the decision lands.
Index strength continues to lean on a narrow leadership group while most constituents grow earnings more slowly, which preserves resilience but raises fragility should leadership falter. Recent bankruptcies read as control and documentation failures rather than macro stress, directing focus toward cash dominion, collateral perfection, and servicing discipline instead of broad de-risking. In New York City, office fundamentals are normalizing as leasing and absorption improve within State guardrails, leaving outcomes to be decided by asset quality and refinancing mechanics more than by political headlines.
Market Signals/The Conversation
The Labor Market
With official data unavailable for much of October due to the government shutdown, investors turned to alternative indicators to gauge employment dynamics. The Challenger, Gray & Christmas report made headlines with record-high job-cut announcements, Through October, employers have announced 1,099,500 job cuts, an increase of 65% from the 664,839 announced in the first ten months of last year.
But context matters, after adjusting for DOGE reductions the underlying trend appears far less severe. Year-to-date job cut announcements in the “government” industry as classified by Challenger, Gray & Christmas marked ~307k, which is more than 8x the 2024 year-to-date total. Because measured output per worker in the government sector is either stagnant or not well-captured, each additional public-sector job tends to contribute less to GDP growth than a job added in a high-productivity private industry, like technology. When we adjust the overall figures to exclude these government cuts, year-to-date job cuts increased 26%, still an increase, but below the 41% average year-over-year change (in either direction) experienced since 2003.
Possibly the most concerning part of the report was that AI was the 6th highest reason for job cuts. Firms using artificial intelligence expect generative AI to displace a large number of relatively low-value-added service jobs, often those taken up by younger cohorts of the labor force.
Entry-level disruptions create a “missing rung” on the labor ladder, slowing skill formation and household formation over time. It also bifurcates income growth — high for mid-career talent, weak for new entrants — embedding inequality into the next expansion cycle. As Cameron Crise at Bloomberg reported, the ratio of young adults unemployed relative to the total unemployed has hit an all-time high.
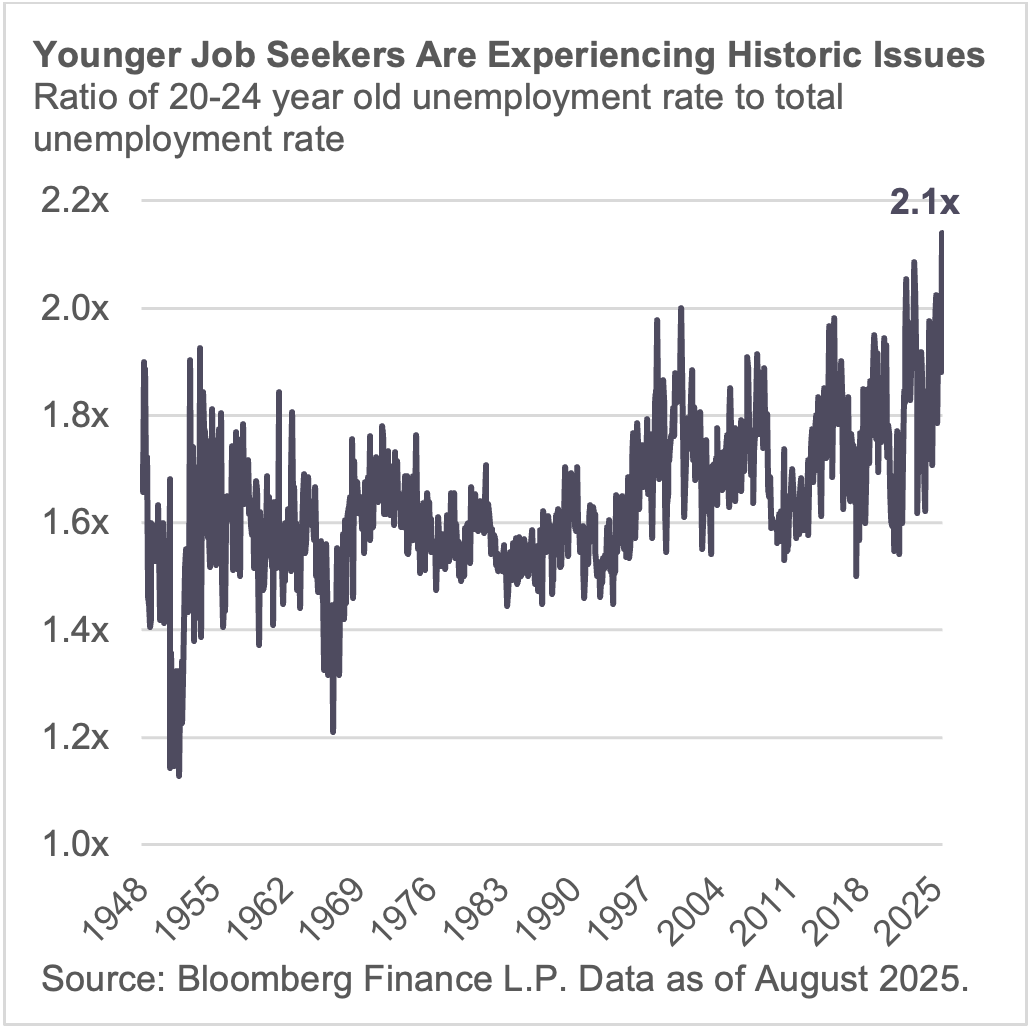
As the labor market sits in a low-hire low-fire stasis, we think the risks to watch present themselves most to younger, educated workers.
The Fed
After months of restrictive policy and liquidity withdrawal, the Fed’s tone has become more balanced. Policymakers still believe that current rates are restrictive, but they are moving cautiously as they ease them. In Powell’s own words on the limited visibility the Fed has amid delayed data releases “If you’re driving in the fog, you slow down.” Consequently, investors have pulled back on their expectations for further easing.

The pullback in rate cut expectations aligns with green shoots in inflation progress, particularly through lower shelter costs which has cooled to 3.6% year-over-year in September versus 4.8% at the same time last year. As such, expectations for inflation have cooled in recent months. Two-year inflation swaps have dropped from over 3% in September, to 2.6%, which is the lowest level since January.
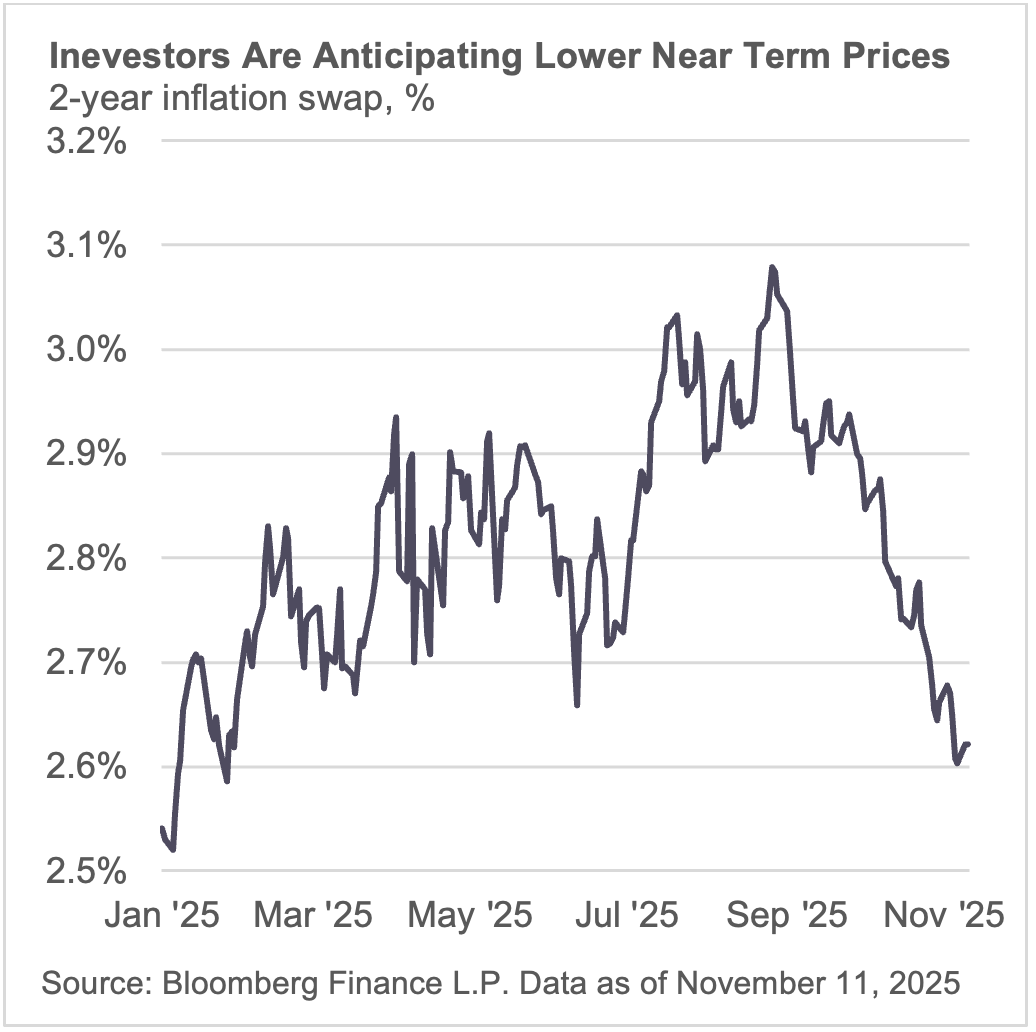
The near-term upward risk to both inflation expectations and the number of rate cuts comes in the form of the new Fed Chair announcement – who presumably will have a dovish leaning – expected by end of this year.
Tariffs
The U.S. Court of International Trade in May 2025 ruled that the President exceeded his authority under IEEPA, declaring the IEEPA-based tariffs unlawful for all importers. The Trump administration immediately appealed, and while the appeal is pending, the Federal Circuit issued a stay, meaning tariffs remain in effect until the Supreme Court issues its ruling. The Supreme court heard oral arguments on November 5th, and several justices, including some appointed by Trump, indicated skepticism about whether IEEPA provides such broad tariff authority, citing the need for Congressional clarity in trade policy. Prediction markets are placing more than an 80% probability of the Supreme Court upholding the US Court of International Trade’s decision.
If the Supreme Court upholds the lower court rulings invalidating the president’s use of IEEPA for tariffs, most of the Trump-era and current IEEPA-based emergency tariffs would be struck down, including:
- Reciprocal tariffs on China (10% current)
- Canada (25–35%), and Mexico (up to 25%)
- 10% universal tariff on many imports
- Fentanyl/drug trafficking tariffs (20–25%)
If these emergency tariffs are struck down, the administration hasn’t shown any indication of abandoning the tariff policy, and more likely would utilize Section 122, which allows the President to impose temporary tariffs of up to 15% for up to 150 days without an investigation. Providing interim tariff revenue to the administration while they investigate longer-term alternatives.
Also on the docket is the potential refunding of IEEPA tariff revenue if deemed illegal. This would create complex logistical challenges and operational uncertainty. Firms might hesitate to file refund requests due to administrative burdens and unclear processes, resulting in a fragmented and prolonged refund implementation.
Ultimately, we see the biggest cost of delay in tariff revenue collection as an impediment to Treasury Secretary Bessent’s stated goal of 3% debt-to-GDP.
Bankruptcies and BDCs
First Brands and Tricolor were primarily control failures, not macro stress. First Brands’ liquidity squeeze exposed off-balance-sheet financing and receivables-control gaps (no Deposit Account Control Agreements [DACAs] or direct-pay mechanisms), hastening default. Tricolor unraveled through double-pledging across fragmented title systems with weak VIN-level reconciliation, turning a funding freeze into Chapter 7. In both, borrower-led servicing, delayed verification, and imperfect collateral perfection—not economy-wide deterioration—drove outcomes.
Exchange-listed BDCs sold off following headlines and lower front-end rates after Fed cuts, not because of direct exposure. Look-throughs showed negligible Tricolor positions and only a small, identified pocket of First Brands debt across roughly 15 vehicles (~$237mm, about 0.05% of ~$503bn BDC AUM), with the larger exposure in broadly syndicated loans. Pricing reflected optics and rate math more than asset impairment.
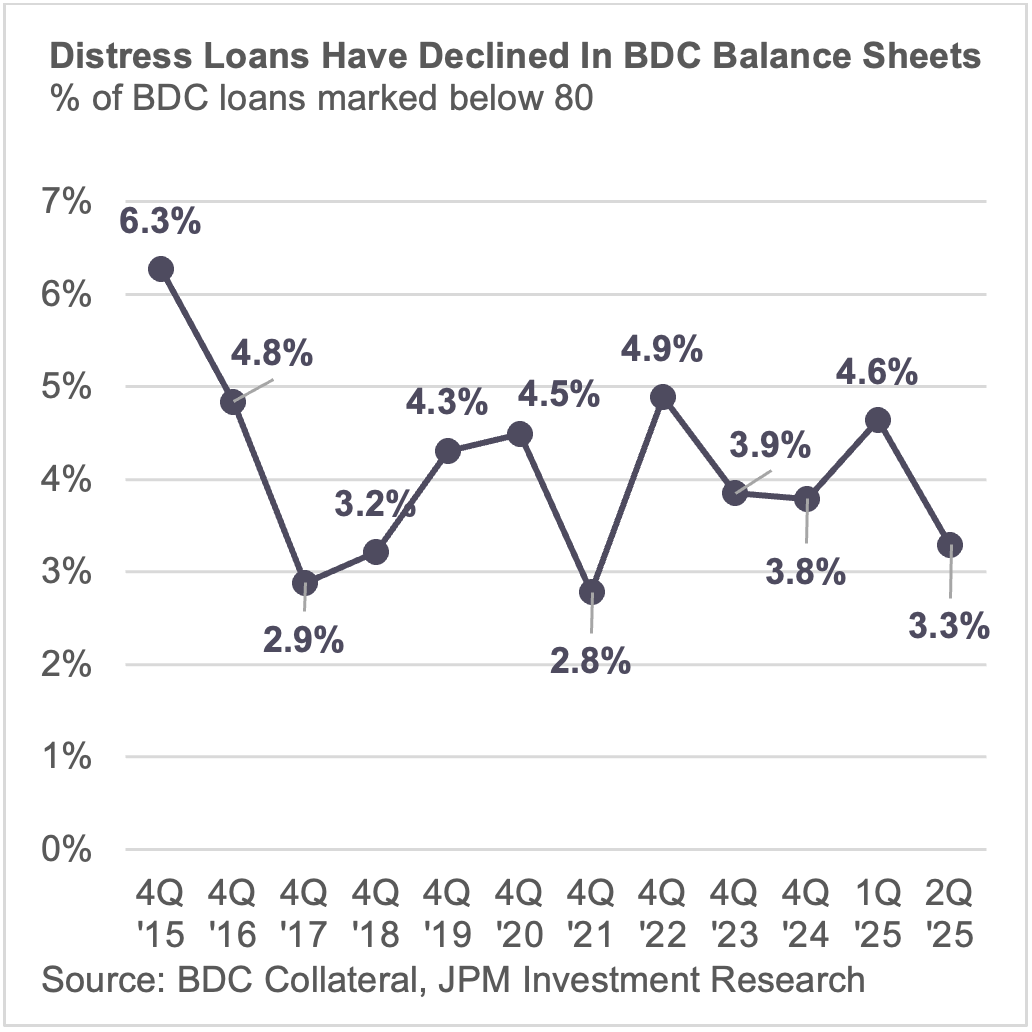
PIK sits in the middle of that narrative. It has been used more frequently but mainly as a designed liquidity bridge at origination, not as an ad-hoc patch for stress. Effective structures hard-wire discipline with mechanical triggers that revert to cash-pay when coverage or leverage normalizes, accrual caps to prevent compounding, and springing sweeps when liquidity improves. Where those features are absent, PIK simply defers recognition and raises loss-content risk. Recent portfolio reads are consistent with moderation rather than escalation: distressed marks in BDC holdings remain limited, PIK income shares have edged lower from late-2024 peaks, and the share of “bad PIK” (post-origination deferral) is essentially flat to down from 2023 levels.
Taken together, the through-line is structural. Bankruptcies highlighted verification and control gaps; market pricing reflected rate resets and headline sensitivity; and PIK usage, where properly documented, functioned as a liquidity tool rather than a distress signal. The story is one of plumbing and paperwork—cash dominion, collateral perfection, and continuous reconciliation—more than one of cyclical credit fatigue.
Earnings and the Consumer
Q3 headlines were solid, but the story underneath is segmentation. Broad S&P 500 beats and double-digit EPS growth framed the quarter, yet management commentary described spending that is holding at the top of the income distribution and thinning at the bottom.
Consumer bellwethers set the tone. McDonald’s posted positive U.S. comps while noting industry traffic among lower-income guests down nearly double digits, with higher-income visits steadier. Big-box retail echoed the split: share gains from upper-income households alongside heavier trade-down and private-label adoption among value-oriented shoppers. The same pattern showed up in restaurants with higher average checks. Chipotle pointed to softer transactions late in the quarter even as unit growth continued, and Cava described resilient premium occasions with more selectivity from younger diners.
Pulling these signals together, earnings do not point to a broad consumer retrenchment; they point to a rebalancing. Companies tethered to higher-income customers, premium experiences, and corporate travel are maintaining throughput and margin stability. Businesses reliant on frequent, lower-ticket visits are managing mix, promotions, and costs to defend volumes. Aggregate profitability remains positive, but the driver is no longer “the consumer” in the singular; it is which consumer each business serves and how that mix interacts with pricing power, unit growth, and fixed-cost intensity.
NYC Real Estate Post Election
New York City’s mayoral result stirred familiar concerns—rent freezes, higher operating costs, slower approvals, and the risk that high earners relocate—each of which could weigh on leasing, NOI growth, and refinancing outcomes. Those risks meet two constraints: the state’s role in authorizing major changes, and a market that has already been quietly improving.
A large share of the most impactful ideas sits in Albany’s hands. Broad rent caps beyond the existing stabilization system, revisions to the property-tax architecture and major abatements, changes to transfer and mortgage-recording taxes, and portions of labor and environmental rules are governed by state statute. Without enabling legislation, City Hall cannot move quickly on these fronts, which tempers both the scale and the speed of any shift.
On the ground, fundamentals are doing more of the talking. Manhattan availability and vacancy have tightened to multi-year lows after four consecutive quarters of positive absorption. Leasing volumes are tracking above pre-pandemic norms, and Class A Midtown vacancy sits well below the marketwide rate, underscoring the flight to quality. Office-using employment continues to expand, and national office utilization has pushed to post-2020 highs, providing a clearer baseline for space demand.
In this setup, outcomes are being set less by political headlines and more by asset quality, lease-roll timing, capital access, and the mechanics of refinancing. Well-located, amenitized buildings continue to capture a disproportionate share of demand, while older commodity stock bears the adjustment.