Cutting Through the Noise: Three Signals for Year End
The Rithm Take
Bottom Line: November’s usual year-end rally has not shown up this year, with equities lower and the 10Y higher month-to-date. Sticky inflation, a slowing housing market, and rising volatility and dispersion point to a market that is not paying investors to take on duration or broad market risk. We see that as an advantage for short-duration, income-producing assets, where underwriting and selection drive returns.
Historically, U.S. equity markets have exhibited a reliable seasonal pattern in the fourth quarter, with a strong sprint into Thanksgiving. Looking at S&P 500 monthly returns from January 1970 through October 2026, November is the single best month of the year on average, posting a mean return of nearly +2%. This Q4 strength typically builds off an October recovery from September's seasonal weakness, accelerating into the Thanksgiving holiday as year-end positioning, buyback activity, and improving sentiment converge. Rates also tend to rally, with November the strongest month of the year for the 10-year Treasury.
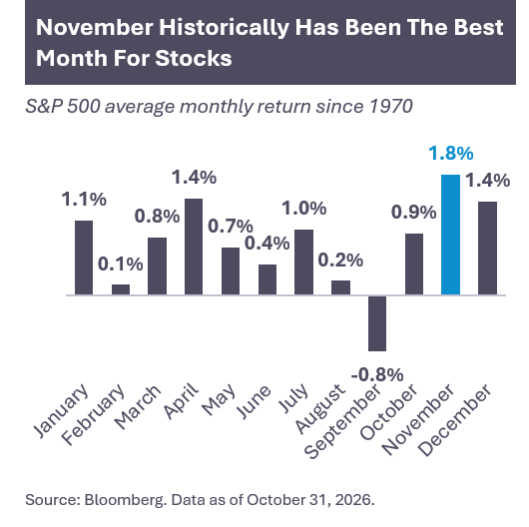
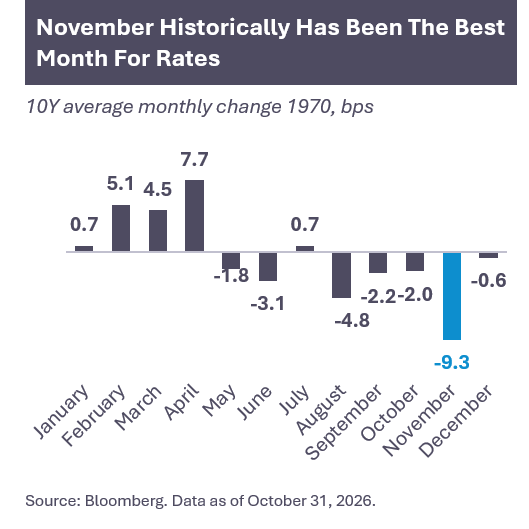
But averages don’t tell the full story, which is particularly true this year. Month-to-date, the S&P 500 and Nasdaq 100 are down 3% and 5%, respectively, and the 10Y has climbed 16bps. There has been plenty of noise throughout November, including the midterms, leadership changes at the largest chipmaker at the center of the AI buildout, and rolling cybersecurity threats. Below we attempt to cut through the noise and outline the signals we are focusing on through year end
First, on the economy, inflationary impulses picked up in the October CPI print. Owners' equivalent rent (a larger and traditionally stickier component) has risen two months in a row, and there is evidence of energy inflation seeping through to broader parts of the economy like core goods. On the labor market side of the equation, a hawkish October jobs report at the beginning of the month printed a decline in the unemployment rate and an addition of 165k jobs – more than double the consensus estimate. Both of those prints led to a repricing of the money market curve amid hawkish commentary from Fed officials.
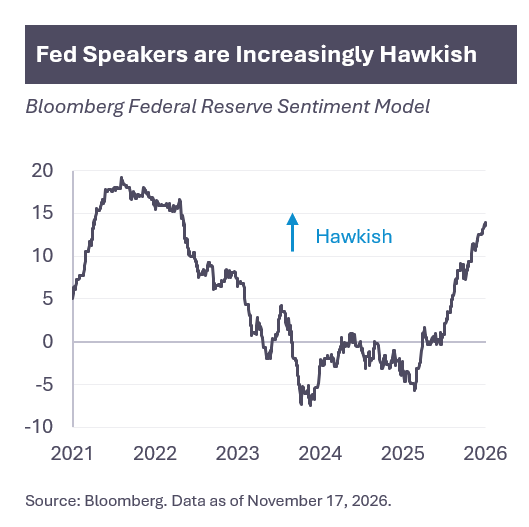
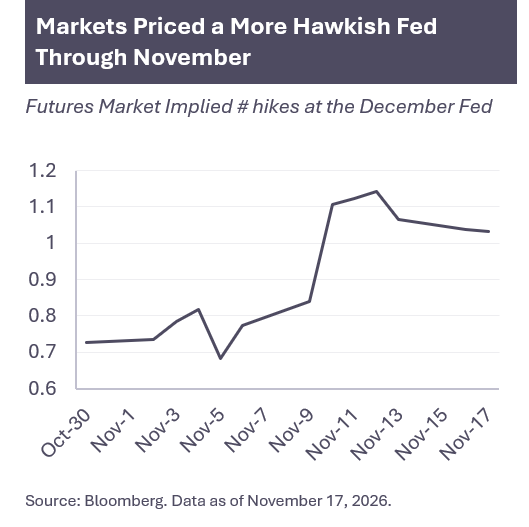
Various measures of the Taylor rule suggest the policy rate should be above 5%, implying another 100bps of tightening, while futures markets are pricing just over 75bps in 2027. The signal we take here is that rates are still accommodative and the Fed will need to remove some of that accommodation and tighten financial conditions to bring inflation (which has been above target for 68 months) back to 2%.
Tightening financial conditions feed into our second signal a housing market in decline with few signs of a near-term turnaround. October existing home sales declined to their lowest level since 2010, while a market survey of homebuilders declined to its lowest level since 2012. Mortgage rates have climbed 100bps year-to-date, further locking in borrowers and leaving just ~1% of homeowners with more than 50bps of refinancing incentive as most homeowners sit on sub-5% rates.
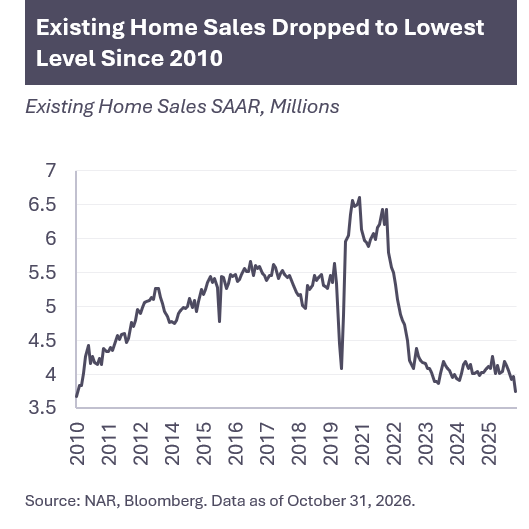
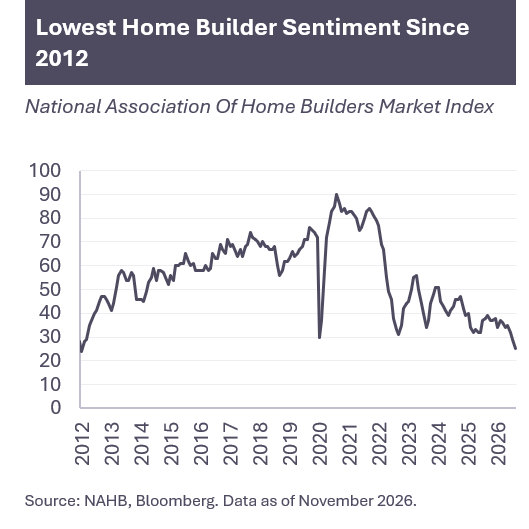
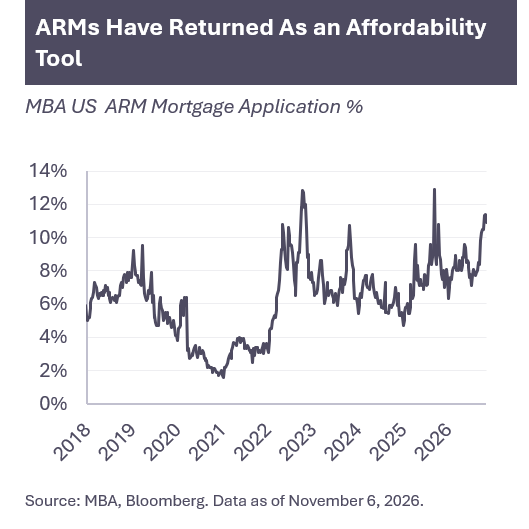
The signal we take from the housing market is a continuation of the themes throughout the year: less housing turnover nationally in an undersupplied market. While housing remains a regional story, affordability at these rate levels is stretched and we expect borrowers will continue to turn to less traditional forms of borrowing to marginally improve payment outlays, most notably in adjustable-rate mortgages (ARMs). ARMs combined with homebuilder concessions have enabled purchases clearing at a 6% rate.
Third, we take signal from the increasing volatility across equities and rates markets. Rates volatility moved first – the MOVE index climbed from ~70 in September to ~110 in October as markets repriced a more hawkish Fed, while the VIX held in the mid-teens. Equities have since caught up, with the VIX rising to ~25 month-to-date.
More telling is what is happening beneath the index level. The Cboe Implied Dispersion Index has risen from ~31 to ~41 since September, meaning options markets are pricing wider gaps between individual stock returns than the index alone suggests. That reflects a market that is starting to separate companies that can carry higher rates from those that cannot.
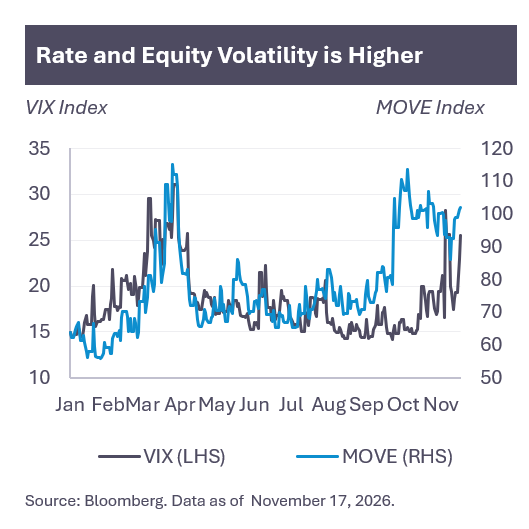
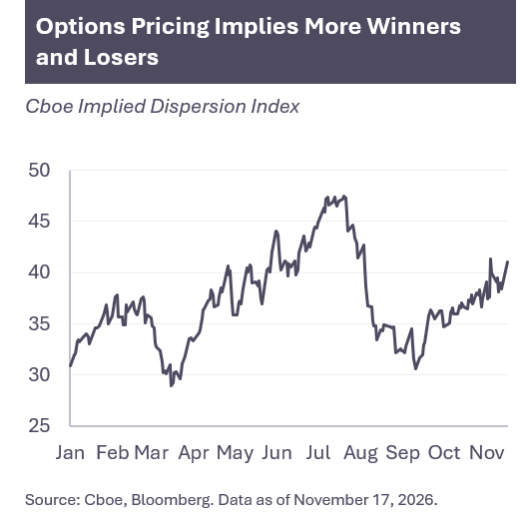
The signal we take here is that returns are likely to be driven more by security selection than by broad market exposure. When rates are rising and volatility is elevated, owning the index means owning both the winners and the losers. We think this is an environment that rewards active management, both in picking which assets to own and in managing duration and funding risk around them.
Put together, these signals leave investors with little reward for taking on duration or broad market risk. A Fed that still needs to tighten keeps upward pressure on front-end rates, flattening the yield curve and leaving little extra yield for extending maturity. At the same time, higher volatility and wider dispersion raise the cost of being wrong on market direction.
We see that as an advantage for short-duration, income-producing assets, where returns come from carry rather than from calling rates or markets. Residential credit offers this across both mortgages and lending to homebuilders. Shorter-dated mortgage loans pay down or reprice quickly, and an undersupplied housing market keeps demand for homebuilder financing in place even as sales slow. In both cases, underwriting and loan selection, rather than market direction, drive returns.