Cross Signals from Housing - New Home Sales & Home Prices Strong, Population Mobility Low
Is a housing rebound music to the Fed’s ears, or is declining mobility flagging structural challenges?
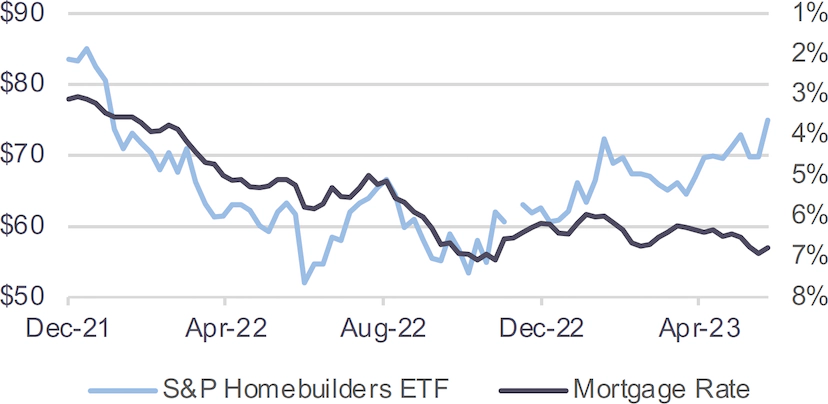
Housing is on a rebound. The S&P Homebuilder ETF has rallied from October 2022 lows, when mortgage rates first hit 7%. Even as mortgage rates have remained at close to these elevated levels, homebuilder stocks have diverged higher.(1)
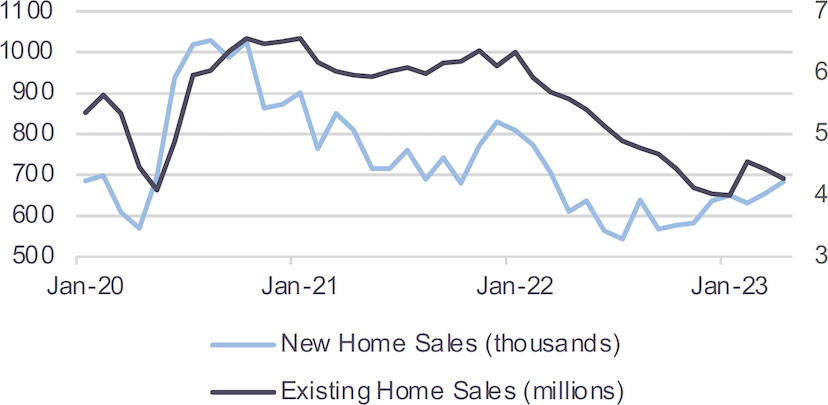
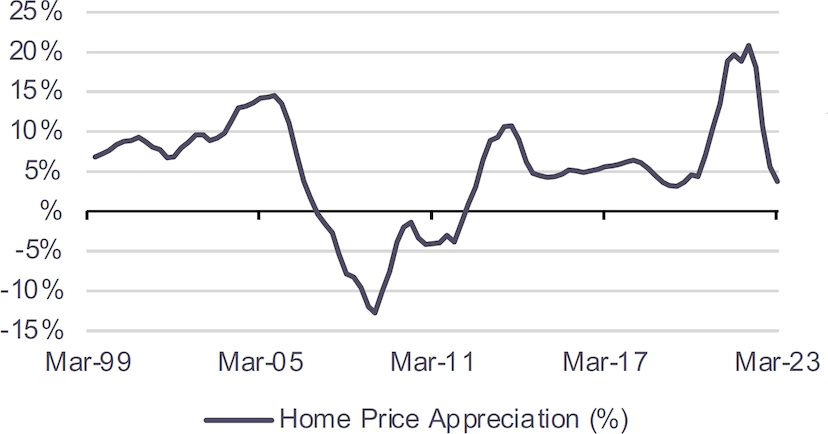
Optimism on housing is also flowing in from other quarters; notably rising new home sales and robust home price appreciation. New home sales, a smaller, though a rising contributor to total home sales, has started to diverge from existing home sales.(2) Homebuilders are incentivized to clear inventory by offering a mix of price concessions and mortgage rate buydowns. Existing homeowners are disincentivized given the high cost of foregoing their existing low mortgage rate. The resulting constraint on housing supply has lent support to home prices, which continue to appreciate, although at a slower pace than during the pandemic gush.(2)
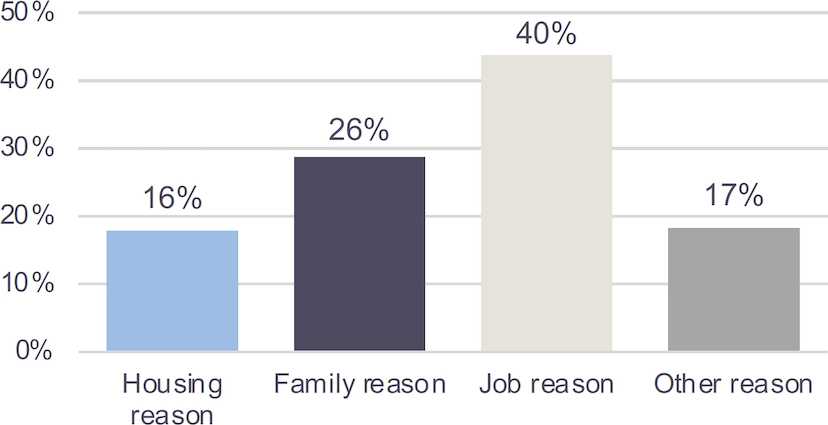
Despite pandemic fueled migration effects, population mobility has been on a multi-decade declining trend. Declining population mobility speaks to a dampening down of economic vitality, countering the optimism reflected in the above metrics. A leading contributor of population mobility is jobs.(3)
How the Federal Reserve digests these trends remains to be seen. As the most sensitive to long-term interest rates, housing faces the transmissions from monetary policy more directly than other sectors. Does the FOMC view housing’s turnaround as a signal to do more? Does strong employment and unfilled jobs help with mobility, be that of owners, but especially renters who stand to benefit from open positions? Or does a recession materializing reverse this complex of indicators? All stand to form inputs in monetary policy making ahead.
Homebuilder Stocks Rallying Despite High Mortgage Rates Prevailing(1)
New Home Sales Rising Relative to Existing Home Sales(1)
Home Prices Continue Appreciating Even After the Pandemic Fueled Gains(2)
Jobs Are a Key Driver of Mobility(3)