Are the Commercial and Residential Markets Heading in Opposite Directions?
While there is growing evidence that residential housing activity has stabilized in early 2023, signs of stress in the commercial real estate markets are beginning to appear
Stabilization of Residential Housing
- The NAHB Homebuilder Sentiment Index rose for the fourth straight month to 45 in April. This index had previously declined for 12 consecutive months, hitting a low of 31 in December 2022.
- Both single-family housing starts and building permits increased in March for the second straight month, increasing 4.6% and 13.4% month-over-month, respectively.
- Although single-family existing home sales declined moderately in March, these sales rose on average in the first quarter of 2023 for the first time since the fourth quarter of 2021.
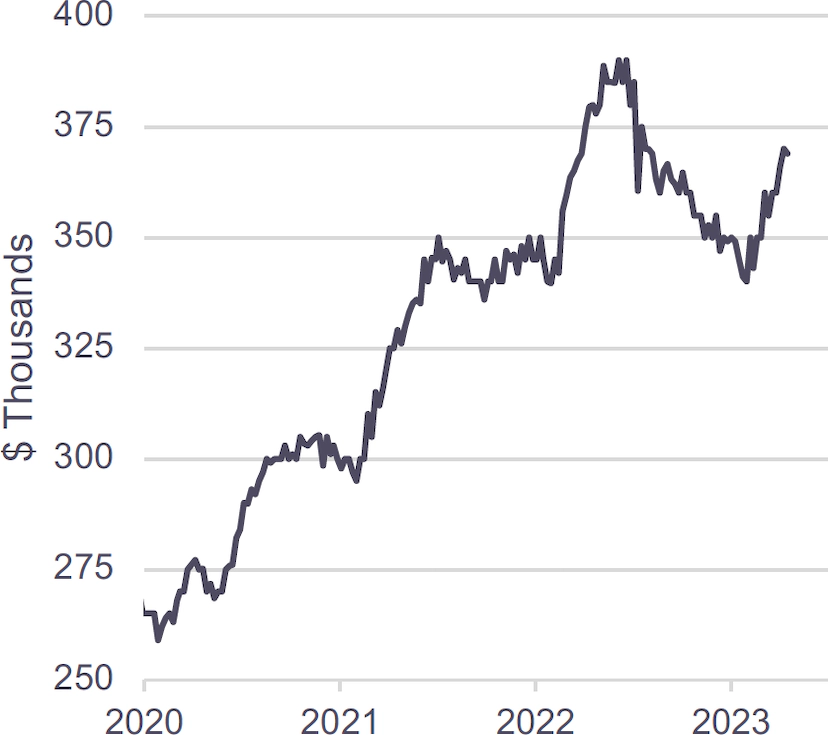
- Data indicates that home prices have begun to rise again (see “Redfin Metro Median Sales Price” chart), though these prices continue to trend lower on a year-over-year basis.
Redfin Metro Median Sales Price(1)
Commercial Real Estate Signs of Weakness
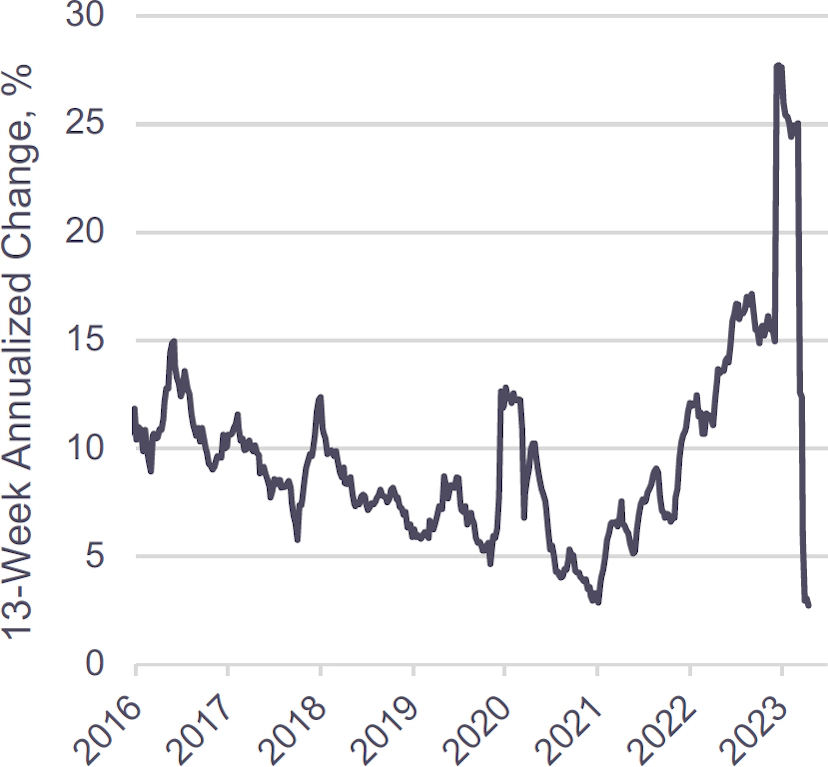
- Lending by small banks for commercial real estate has sharply declined in 2023 (see “Small Bank Commercial Real Estate Loans” chart). Early May will bring an update from the Fed on lending standards as reported by senior loan officers, but it seems reasonable to expect a further tightening of standards for smaller firms.
- Despite unemployment near 50-year lows, overall US office vacancies were 18.7% at the end of 2022, the highest levels since 2005.
- Multi-family housing starts and permits both declined in March, while condo and co-op sales fell in the first quarter of 2023.
- ~$1.1tn of commercial mortgages are expected to mature in 2023 and 2024, of which ~$260mm are CMBS loans.
Small Bank Commercial Real Estate Loans(2)
Relevant Market Metrics
Market Spreads(1)
|
Index |
December 31, 2021 |
December 31, 2022 |
March 31, 2023 |
|---|---|---|---|
|
2Y Treasury Yield |
0.73% |
4.43% |
4.03% |
|
10Y Treasury Yield |
1.51% |
3.87% |
3.47% |
|
Primary Mortgage Rate |
3.11% |
6.41% |
6.24% |
|
IG 5 Spread |
50 |
82 |
76 |
|
HY 5 Spread |
293 |
484 |
463 |
April saw slight stabilization month-over-month in relevant indices, unlike the volatility seen throughout the first quarter of 2023.
Markets Now Priced for May Fed Rate Hike Followed by Cuts in the Second Half of ’23
- Immediately following the mid-March banking turmoil, interest rate futures markets implied only one more quarter-point rate hike at the March FOMC meeting, followed by a pause. However, the weeks that followed the March Fed meeting brought continued strong labor market data and elevated inflation readings. As of May 1, markets put the odds of an additional quarter-point rate hike at the May FOMC meeting at 89%.
- Interest rate futures imply the fed funds rate being lowered shortly after the May meeting, with approximately 50bps of cuts priced in by the end of 2023. Fed officials have consistently indicated that rate cuts in 2023 are not reflective of their baseline views on the monetary policy outlook.
- Fed lending to banks via the discount window and the new Bank Term Funding Program (BTFP) surged $160.2 billion in the immediate wake of the failures of Silicon Valley Bank and Signature Bank. Combined lending via these facilities then declined for four straight weeks by a cumulative $25.3 billion, suggesting some easing of strains in the financial sector. Discount window plus BTFP lending has risen for the last two weeks by a cumulative $15.7 billion.
- The Fed’s lending facilities have generous terms (including Treasury and Agency MBS collateral being valued at par) so assessing financial stress by the usage of these programs is not straightforward. Broader measures, such as the index published by the St. Louis Fed, point to an easing of financial stress.
Implied terminal fed funds rate from interest rate futures(2)
Implied end-2023 funds rate based on January 2024 contract(2)
FOMC participants’ median projected December 2023 fed funds rate(3)