Q2 Check-In On NBFI Lending
NBFI (non-bank financial institution) lending reached $1.997 trillion in June, up $67.7 billion from March and $392.5 billion from a year earlier. NBFI's share of all commercial bank loans rose to 14.4%, up from 14.2% in March and 12.4% a year ago. The pace of growth has slowed for five straight quarters, from $144 billion in Q2 2025 to $68 billion in Q2 2026.
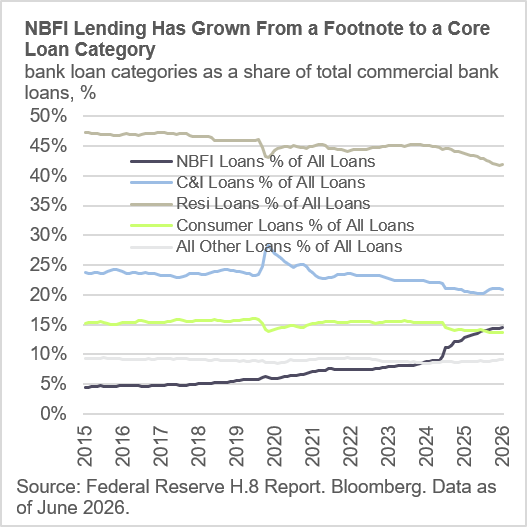
Bottom line: NBFI lending has more than doubled since the start of 2023 while the deposit base that funds bank balance sheets grew just 11%. That gap is the structural reason non-bank capital, insurance companies and asset managers with long-duration liabilities, keeps finding room to grow inside a banking system that cannot fund this kind of loan growth on short-duration deposits alone.
The mix is shifting toward fund finance. Granular call-report data, a subset of the Fed H.8 report spanning 914 named reporting institutions, lets us look inside the NBFI (nondepository financial institution) category, the call-report classification for the same set of exposures tracked as NBFI in the Fed's H.8 release. Five sub-categories drove the $50.6 billion in bank-level NBFI growth this quarter. PE (private equity) and NAV (net asset value) lending lines, fund finance, added $26.8 billion and grew 7.2% quarter-over-quarter, the fastest of any category and now the single largest driver at 53% of net growth. Private credit and warehouse facilities added $11.4 billion, 22% of growth. Mortgage and CRE (commercial real estate) company lending added $9.8 billion. Consumer credit entities were down, off $2.5 billion.
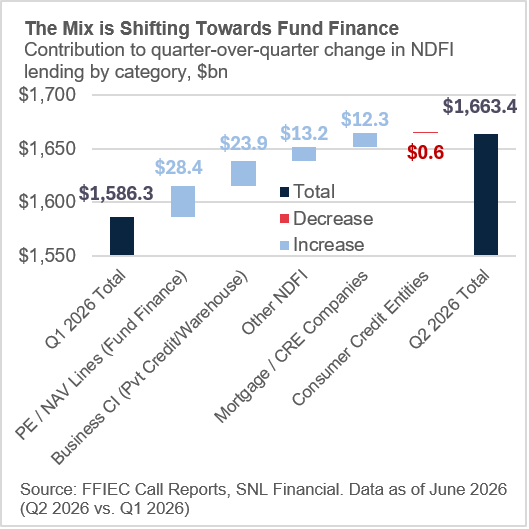
Warehouse lending is inventory finance, banks funding origination pipelines that get termed out through securitization. Fund finance is different, banks lending directly against asset manager and insurance company balance sheets: subscription lines, NAV facilities, capital call bridges. Both are ABF (asset-based finance) adjacent. Fund finance growing fastest points to the non-bank capital base itself scaling, with banks increasingly financing the vehicles rather than just the underlying assets.
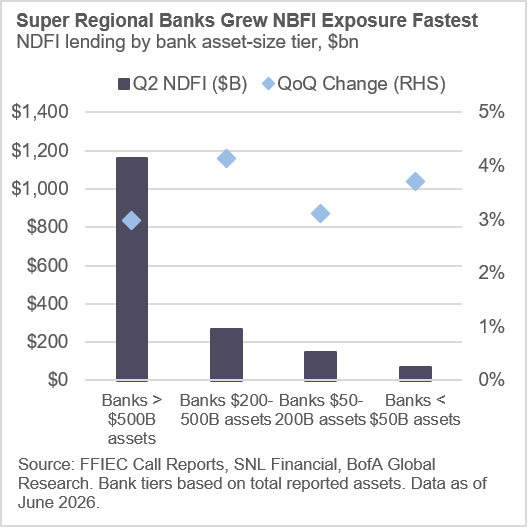
The $200–500 billion tier is growing fastest, but scale still sits with the largest banks. Tiering banks by actual reported total assets, nine institutions with more than $500 billion in assets hold $1.16 trillion in NBFI exposure, 71% of the tracked total, and added $33.6 billion this quarter, 66% of growth. Sixteen banks in the $200–500 billion asset tier added $10.6 billion, growing 4.2% quarter-over-quarter (QoQ), the fastest pace of any tier and a disproportionate 21% of growth versus their 16% base. Banks with $50–200 billion in assets and those under $50 billion grew broadly in line with the system average of 3.2%, at 3.1% and 3.7% respectively.
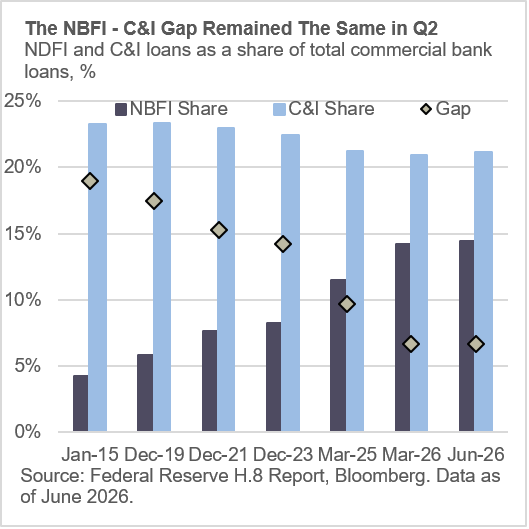
Convergence with C&I (commercial and industrial) lending stalled this quarter. NBFI lending closed to within 6.7 percentage points of C&I as a share of total bank loans a year ago, down from 9.6 points twelve months earlier. That gap held flat this quarter, 6.7 points in both March and June, as both categories grew at a similar pace for the first time in over a year.
The deposit constraint is showing up in the data now. NBFI lending is up 118% since Q1 2023. Nominal GDP is up 19% over the same stretch. Bank deposits are up 11%. NBFI lending has grown roughly six times faster than deposits and ten times faster than the broader economy it partly finances.
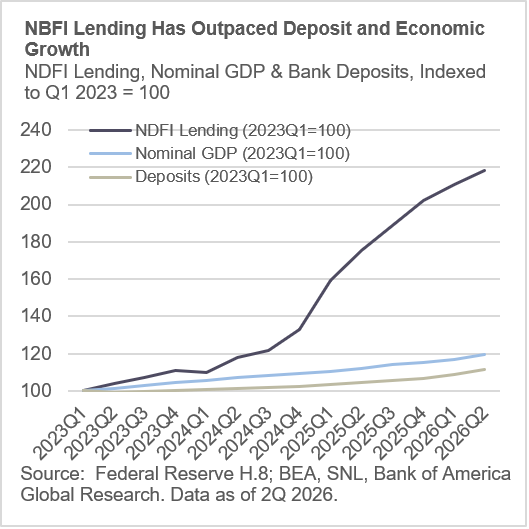
Banks are duration-constrained on the liability side. Most deposits are short-duration and can walk out the door in a way term-funded institutional capital cannot. Loan growth concentrated in one balance-sheet category, outpacing the deposit base by this much, can either be held along with the duration mismatch, or distributed via warehouse lines and fund-finance facilities. Insurance companies and asset managers, funded by long-duration liabilities, are the natural counterparty on the other side of that choice. The deposit math explains why the ABF and private credit trade keep compounding across multiple quarters rather than showing up as a single outlier print.
A note on data series sourcing: H.8 and SNL call-report NBFI figures reflect different reporting populations and are not directly comparable. H.8 estimates system-wide bank lending to nondepository financial institutions across the full commercial banking system. The call-report tracker below reflects the roughly 914 largest individually reporting institutions and will run below the H.8 total. The figures used are H.8. and the category and tier detail is call-report.
Correction: an earlier version of this piece overstated bank-level NBFI growth due to call-report source data duplicating one institution's exposure across three same-named banks. The H.8-based figures, and the piece's conclusions, are unchanged.